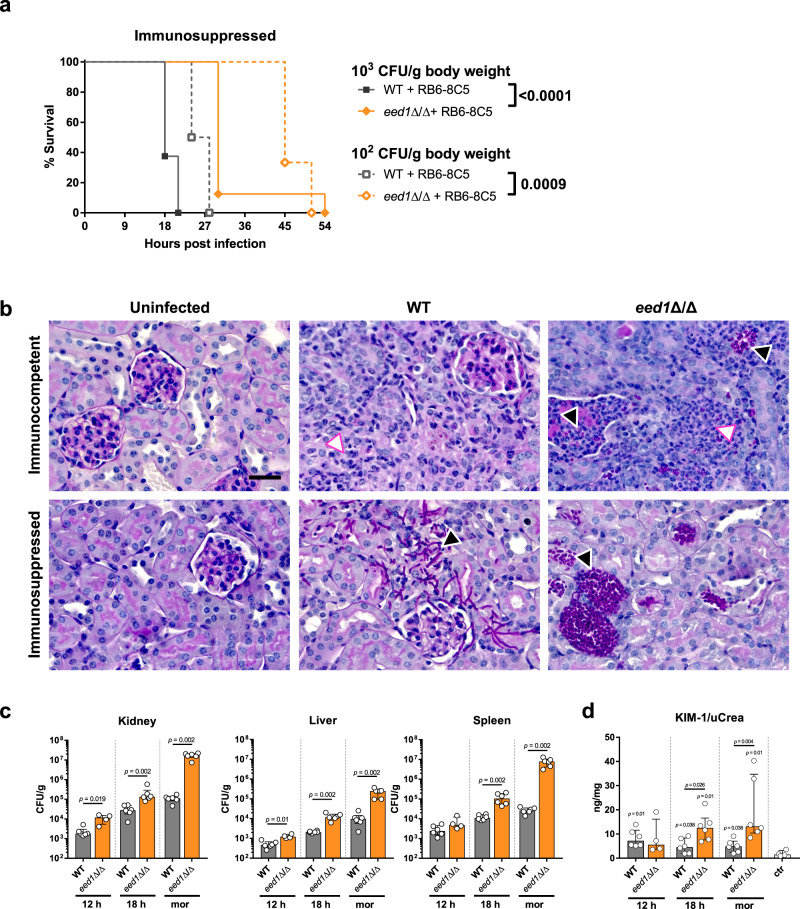
Fig. 9. Systemic infection with the C. albicans eed1Δ/Δ mutant leads to delayed mortality of immunosuppressed mice despite higher fungal burden accompanied by increased kidney injury compared to mice infected with the WT.
Mice that were rendered immunosuppressed by depletion of neutrophils and monocytes using the RB6-8C5 antibody were intravenously infected with 1 × 10², 1 × 10³ or 1 × 10⁴ CFU/g body weight of C. albicans WT (SC5314) or eed1Δ/Δ mutant. a Survival of mice was monitored after infection with 1 × 10² CFU/g or 1 × 10³ CFU/g body weight for 21 days. Survival of mice infected with 1 × 10² CFU/g (n = 6 per group) or 1 × 10³ CFU/g body weight (n = 8 per group) is shown as Kaplan–Meyer curve and curves were compared using the two-sided Log-rank (Mantel–Cox) test. p-values are shown in the graph. b Representative images of PAS stained histological cross sections of kidneys from moribund immunocompetent or immunosuppressed mice infected with 104 CFU/g body weight of WT or eed1Δ/Δ mutant. Immunocompetent and immunosuppressed uninfected control mice were sacrificed 7 d after mock infection. Black arrows point towards purple stained C. albicans hyphae (WT) or yeast (eed1Δ/Δ mutant), white arrows towards immune cells infiltrating the renal tissue. Scale bar represents 20 µm and applies to all images. c Organ fungal burden of immunosuppressed mice infected with 1 × 10² CFU/g body weight 12 h and 18 h post infection and when moribund (mor). d Quantification of kidney injury by measuring and normalizing urinary KIM-1 to urinary creatinine level. c, d Two independent experiments, n = 6, except for eed1Δ/Δ mutant 12 h, n = 4; controls, n = 4. Data are shown as median with interquartile range and were compared using the two-sided Mann–Whitney test. p-values are shown in the graph. d p-values above bars represent significant changes in comparison to the uninfected control. Source data are provided as a Source Data file.

