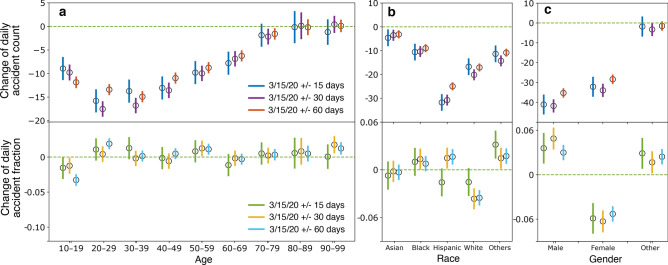
Figure 2.
Change of daily accidents across age, race, and gender groups. Top: Change of daily accident count. Bottom: Change of daily accident fraction (the fraction of daily accidents among all accidents that day for each group). 95% confidence intervals are shown as vertical bars for each data point. Also shown are estimates from three time windows: 15 days (blue and green), 30 days (purple and orange), and 60 days (red and cyan) before and after the mobility change-point.

