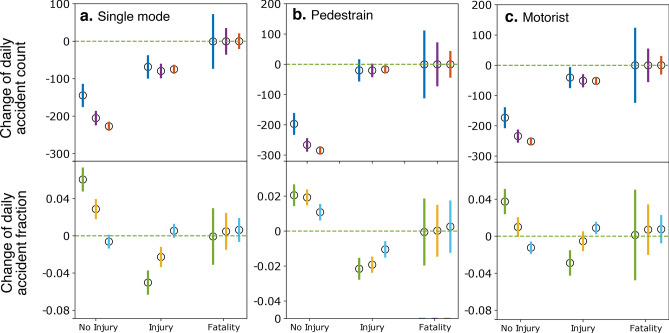
Figure 4.
Change of daily accidents in NYC after the mobility change for different severity levels: no injury, injury, and fatality. The accidents are divided into three types: (a) not involving other transportation modes, (b) involving pedestrians, and (c) involving motorists. 95% confidence intervals are shown as vertical bars for each data point. Also shown are estimates from three time windows: 15 days (blue and green), 30 days (purple and orange), and 60 days (red and cyan) before and after the mobility change-point.

