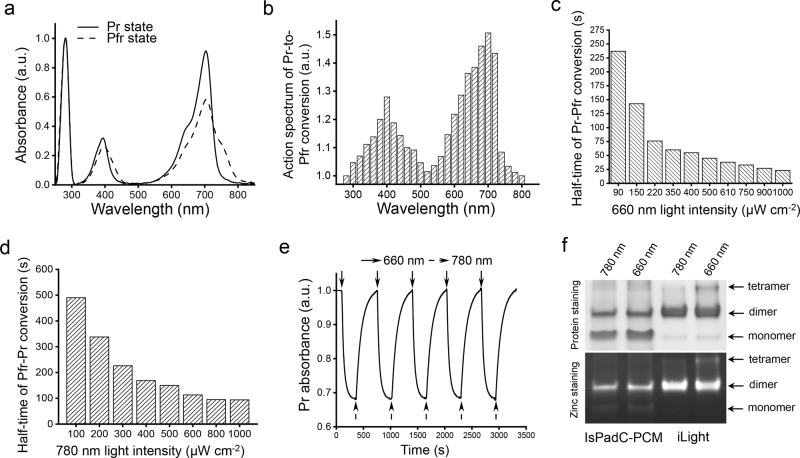
Fig. 3. Spectral and photochemical properties of the purified iLight protein.
a Absorbance spectra of iLight in the ground Pr state (solid line) and after the photoconversion to the Pfr state (dashed line). b Action spectrum of the Pr → Pfr photoconversion upon irradiation with light of specific wavelength measured as the relative decrease of the Pr state absorption at 704 nm. c Dependence of the half-time of the Pr → Pfr photoconversion on the intensity of 660/15 nm light. d Dependence of the half-time of the Pfr → Pr photoconversion on the intensity of 780/30 nm light. e Absorbance of iLight in the Pr state during repeated illumination cycles with 660/15 nm light and then with 780/30 nm light. Absorbance was measured at 704 nm. f Native PAGE of wild-type IsPadC-PCM and iLight. Top: proteins were illuminated with either 780 nm (photoconverting to the Pr state) or 660 nm light (photoconverting to the Pfr state) for 30 min and then run at 20 µg of the protein per lane in darkness. Bottom: ZnCl2 staining of the same gel visualizes the amount of the biliverdin chromophore covalently bound to each oligomeric fraction of the proteins. Arrows indicate the bands of the respective oligomeric states of the proteins. Experiment was independently repeated three times with similar results. In a, b, e, a.u., arbitrary units.

