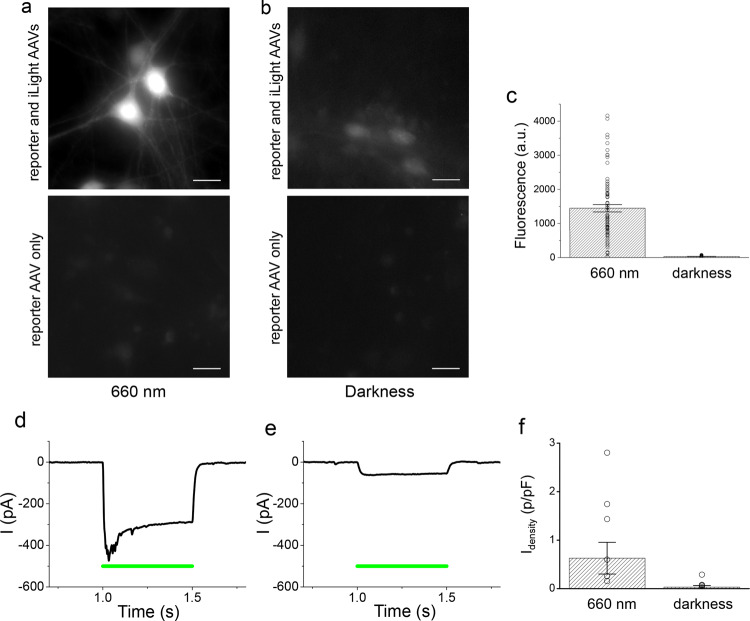
Fig. 6. iLight-induced gene transcription activation in primary cultured neurons.
Murine hippocampal neurons were co-transduced with the iLight optogenetic system and the mCherry and CheRiff reporter AAVs. a, b Representative images of the neurons transduced with iLight system and mCherry AAVs (top images) or with mCherry reporter AAV only (bottom images) incubated for 5 days either under 660 nm light (a) or in darkness (b). Scale bar, 20 μm. Experiments (a, b) were independently repeated three times with similar results. c Averaged mCherry reporter fluorescence in neurons cultured under 660 nm light (n = 53 cells) or in darkness (n = 62 cells), after subtraction of average fluorescence in cells transduced with mCherry AAV alone. The difference between groups was significant (paired two-sided Student’s t-test, exact P-values: T = 6, df = 113, P = 2.3 × 10⁻⁸). The data from typical experiment are presented. Error bars, SEM; a.u., arbitrary units. d, e Representative photocurrent traces in neurons co-transduced with iLight system and CheRiff reporter AAVs incubated either under 660 nm light (d) or in darkness (e) and exposed to 0.5 s of 505 nm light (green line) of 200 mW cm−2 during recording. e The cell responds with small photocurrent, because iLight system is inactive in darkness. Neurons in d, e were voltage-clamped at −70 mV and the photocurrent traces were smoothed by moving average filter with 2 ms window. f Effect of iLight system on photocurrent densities (current normalized by membrane capacitance) in the neurons expressing CheRiff and incubated either under 660 nm light or in darkness (n = 10 cells in each group). The difference between the two groups of neurons was significant (paired two-sided Student’s t-test, exact P-values: T = 2.17, df + 18, P = 0.044). Average photocurrents in the cells expressing CheRiff alone, without iLight system, were subtracted before statistical analysis. Error bars, SEM. Culture medium contained 2 μM biliverdin. Source Data are available as a Source Data file.

