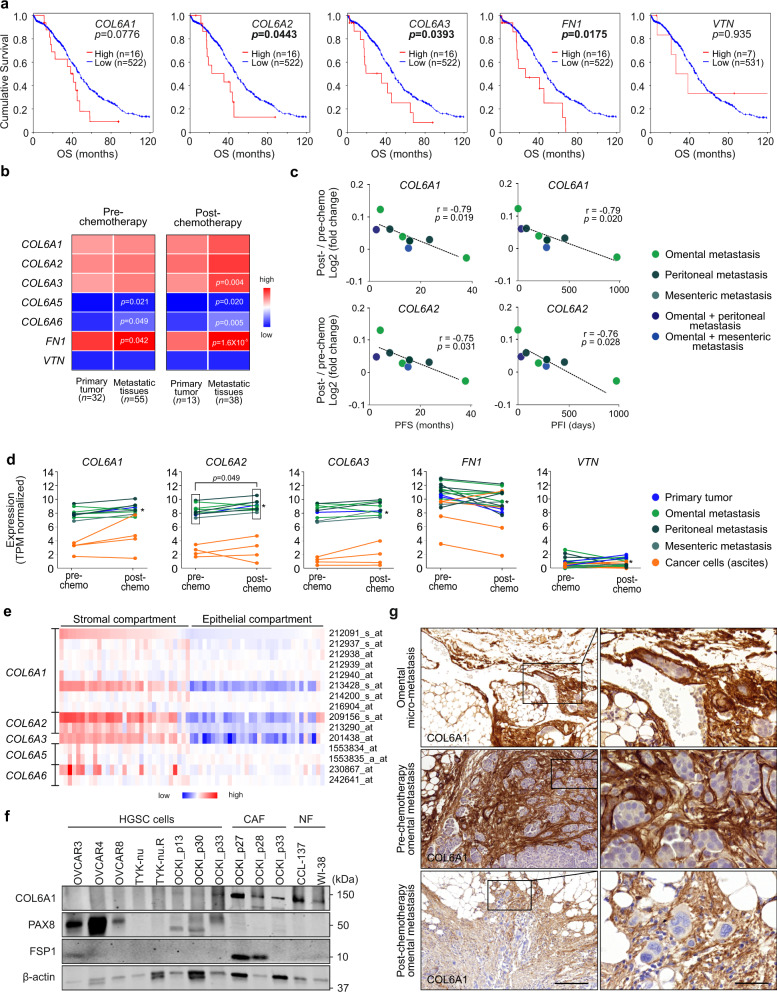
Fig. 5. COL6 increases upon chemotherapy and is associated with poor patient survival.
a Kaplan–Meier curves show the association between collagen (COL) 6A1, COL6A2, COL6A3, fibronectin (FN1), and vitronectin (VTN) expression in chemo-naïve ovarian cancer tissues with overall survival (OS) in The Cancer Genome Atlas (TCGA) dataset; log-rank test. b Heatmap shows average COL6A1-6A6, FN1, and VTN expression in pre- and post-chemotherapy high-grade serous carcinoma (HGSC) RNA-seq of primary tumor and metastatic (omental+peritoneal+mesenteric) tissue patient samples. Benjamini–Hochberg-corrected p value, two-tailed Student’s t test, n = number of samples; the color key indicates the normalized gene expression values (low = 0.00; high = 12.98). c Scatter plots depict the correlation of COL6A1 and COL6A2 expression fold change (post- against pre-chemotherapy) with platinum-free interval (PFI) and progression-free survival (PFS) in HGSC patient- and tissue-matched samples (n = 8); two-tailed Pearson correlation. d Charts illustrate change in expression of COL6A1-A3, FN1, and VTN upon chemotherapy in matched HGSC patient-derived samples (n = 12) from initially platinum-sensitive patients (including partial/complete response or stable disease). Asterisk identifies a patient with longer platinum-free interval (974 days) in comparison to other patients (0–460 days). Significance represents the induced expression of COL6A2 in metastatic tissues post-chemotherapy; two-tailed Student’s t test. See Supplementary Fig. 12c for corresponding charts for COL6A5 and COL6A6. e Heatmap of COL6A1-A6 gene expression in HGSC cells from stromal (n = 31) and epithelial compartments (n = 32; GSE4059529). Used probe IDs as shown; the color key indicates the normalized gene expression values (low = −5.46; high = 7.10). f Immunoblot for COL6A1, PAX8, fibroblast-specific protein 1 (FSP1), and β-actin in HGSC cells, omental metastasis-derived cancer-associated fibroblasts (CAFs), and normal fibroblasts (NFs); n = 2 biological replicates. g Micrographs of COL6A1 immunohistochemistry reveal abundant protein expression in the immediate surroundings of the malignant HGSC foci in omental micro-metastasis and in pre- and post-chemotherapy omental metastases. Images representative of two (micro-metastasis), six (pre-chemotherapy), and ten (post-chemotherapy) patients. Scale bar = 200 µm and 50 µm in inset. See Supplementary Data 26–29 for specific values (b–d). Source data are provided as a Source data file.

