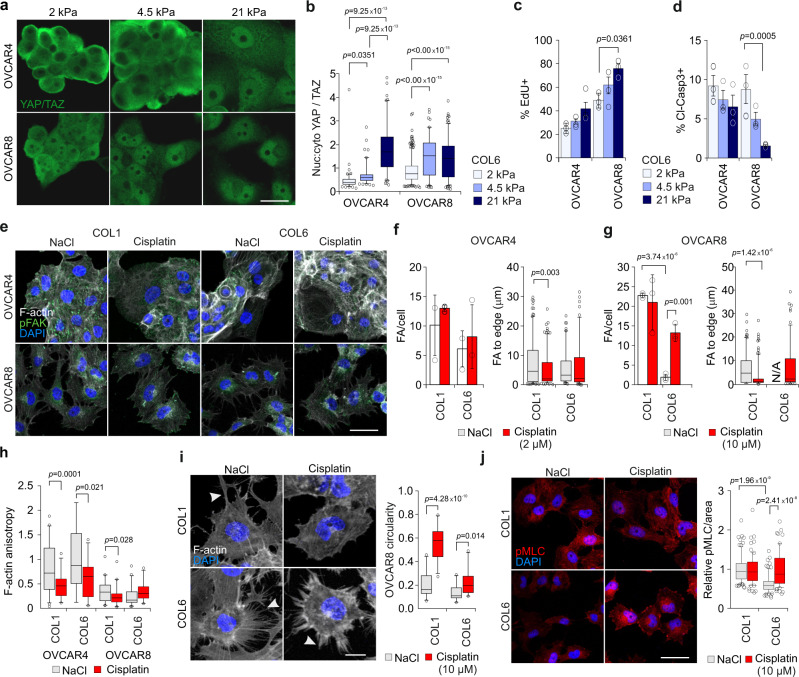
Fig. 7. Cisplatin treatment enhances integrin-based cancer cell adhesion on stiff collagen 6 substrate.
a, b Representative confocal micrographs (a) and corresponding nuclear to cytoplasmic ratio (nuc:cyto; b) of YAP/TAZ (green) in cells on 2, 4.5, and 21 kPa collagen 6-functionalized polyacrylamide hydrogels (COL6-PAA) at 48 h; OVCAR4 n = 114/111/103 and OVCAR8 374/265/165 cells, respectively; Scale bar = 10 µm. c, d Charts depict positivity for EdU in untreated (c) and cleaved caspase3 in treated (cl-Casp3; d) cells on corresponding COL6-PAA at 24 h; see Supplementary Fig. 14c, d for representative micrographs. e–g Representative confocal micrographs of F-actin (phalloidin, white) and phosphorylated focal adhesion (pFAK, green) in cells on 21 kPa COL1 or COL6-PAA at 48 h. Charts show the number and peripheral localization of FAs in OVCAR4 (f n = 186/191 and 103/105) and in OVCAR8 (g n = 118/195 and not applicable (N/A)/103). Scale bar = 25 µm. h Chart depicts the F-actin anisotropy in cells on 21 kPa COL1 or COL6-PAA at 48 h; OVCAR4 n = 47/35, 18/30 and OVCAR8 n = 44/41, 46/27 cells, respectively. See Fig. 7e for representative micrographs. i Representative confocal micrographs of F-actin (phalloidin, white) in OVCAR8 on 21 kPa COL1 and COL6-PAA at 24 h; n = 25 cells. White arrows indicate protrusions. Scale bar = 10 µm. j Representative confocal micrographs of myosin light chain (pMLC, red) in OVCAR8 on 21 kPa COL1 and COL6-PAA at 24 h. Chart indicates pMLC staining intensity per area; n = 86/72 and 75/65 cells, respectively. Scale bar = 25 µm. Data represent mean ± SEM of biological replicates (n = 3 in b, d–j, n = 4 in c). One-way ANOVA with Tukey’s multiple comparison test (b, f, g, i, j, l); two-tailed Student’s t test (c, d, h). Box plots indicate median (middle line), 25th, 75th percentile (box), and 10th and 90th percentile (whiskers) as well as outliers (single points). Source data are provided as a Source data file.

