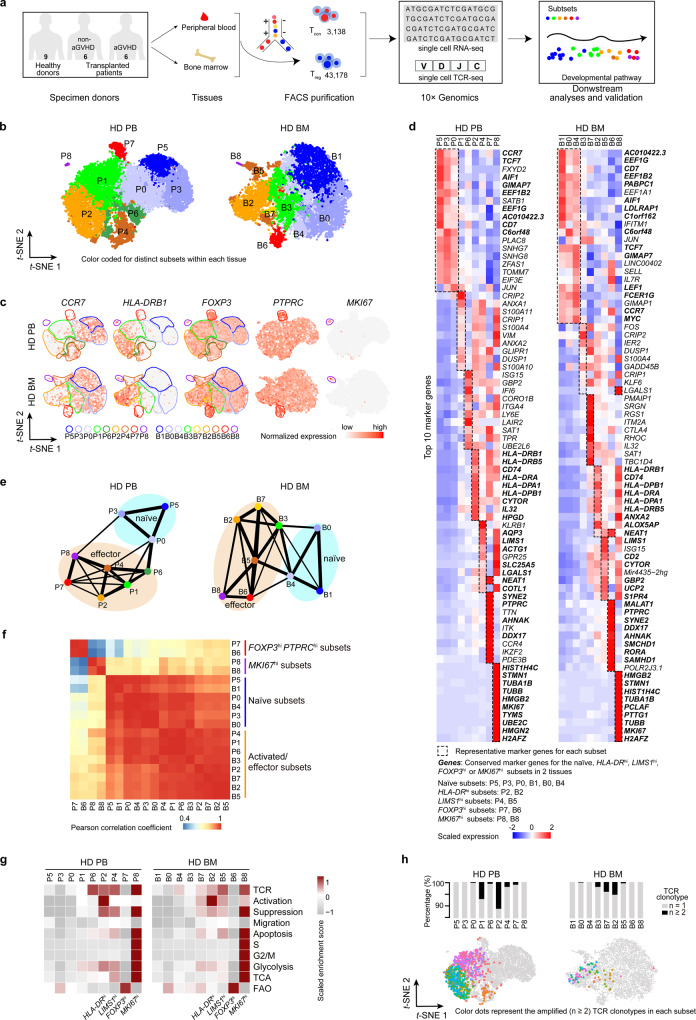
Fig. 1. ScRNA-seq and TCR-seq reveals distinctive subsets among human FOXP3+ Treg cells.
a A scheme showing the overall strategy of this study. b t-SNE of single-cell transcriptomes of Treg cells from healthy donor (HD) peripheral blood (PB, n = 8) and bone marrow (BM, n = 6) samples, colored by subsets. Each subset was numbered and labeled with the first letter (s) of the tissue name (P0 for cluster 0 in peripheral blood, etc.). c Projection of CCR7, HLA-DRB1, FOXP3, PTPRC and MKI67 expression onto the t-SNE plot. d Heatmaps showing the top 10 (by fold change) marker genes for each subset, excluding the ribosomal and mitochondrial genes. Scaled expression means the gene expression was centered and scaled among subsets. The fold change means the values of normalized expression of genes in a specific subset compared to the normalized expression of genes in the other subsets. e Partition graph abstraction (PAGA) analysis. Nodes represent subsets, and thicker edges indicate stronger connectedness between subsets. f Correlograms visualizing the correlation of single-cell gene expression profiles between subsets from HD PB and HD BM. g Heatmaps showing the GSVA enrichment score of Treg cell feature pathways for each subset. h The amplified (n ≥ 2) TCR distribution of Treg cells across different subsets, colored by TCR clonotypes. The insert pictures show the composition of unique and amplified (n ≥ 2) Treg cell TCR clonotypes in each subset. Source data are provided as a Source Data file.

