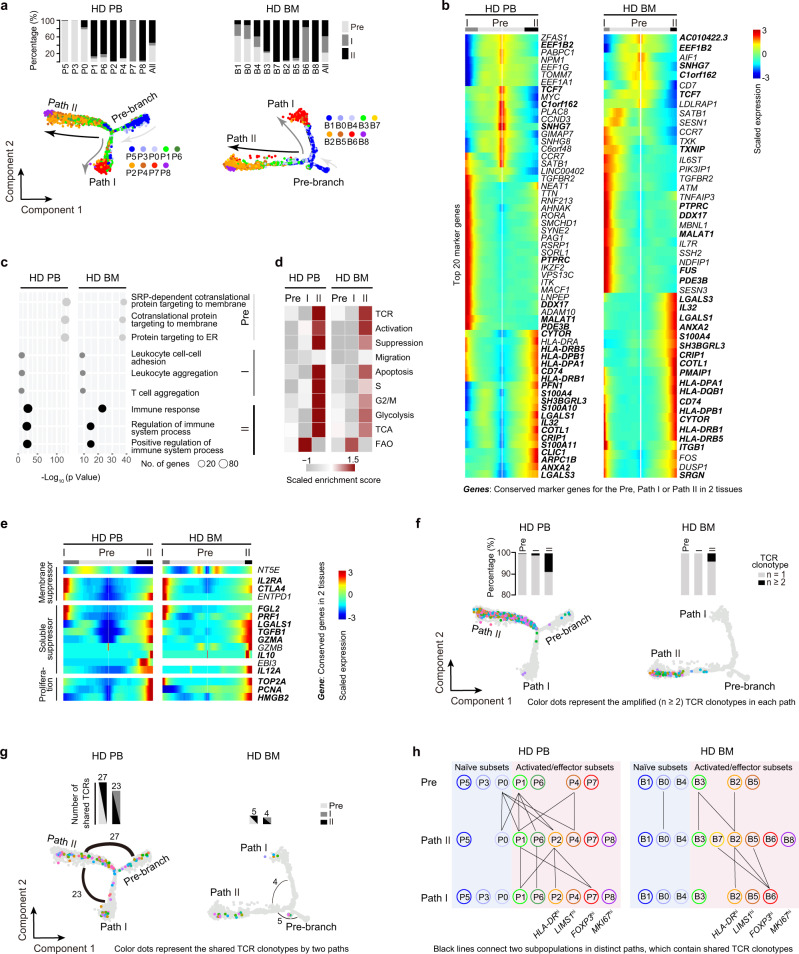
Fig. 3. Pseudotime analysis and scTCR analysis defines two differentiation paths.
a Pseudotime trajectory of Treg cells within distinct tissues, colored by subsets. The insert picture shows the proportions of different Treg cell paths in each cell subset (HD PB: n = 5, HD BM: n = 3). b Pseudotemporal gene-expression profiles of the top 20 (by fold change) marker genes for each path, excluding the ribosomal and mitochondrial genes. c Representative terms from Gene Ontology enrichment analysis of the differentially expressed genes for each Treg cell path. d Heatmaps showing the GSVA enrichment score of Treg cell feature pathways for each different path. e Pseudotemporal gene-expression profiles of suppression and proliferation-associated genes in the Treg cell paths. f The amplified TCR distribution of Treg cells across different paths, colored by TCR clonotypes. The insert pictures show the composition of unique and amplified (n ≥ 2) Treg cell TCR clonotypes in each path. g The shared TCR distribution of Treg cells between any two paths, colored by TCR clonotypes. The thickness of the black solid lines representing the relative numbers of shared TCRs. The insert pictures show the numbers of TCRs shared by two paths. h The shared TCR distribution of Treg cells between any two subpopulations in different paths. The black lines connected two subpopulations, which contained shared TCRs. Source data are provided as a Source Data file.

