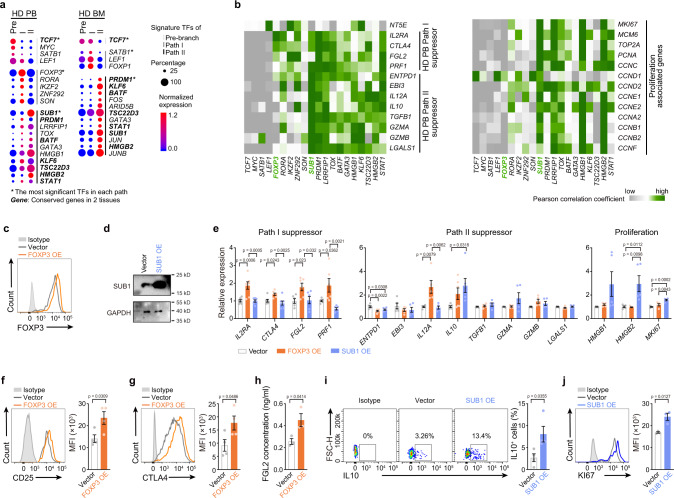
Fig. 5. Transcription factors enriched in Treg cell differentiation paths.
a Dot plots showing the transcriptional factors (TFs) which were differently expressed in each Treg cell path (p < 0.05, log FC > 0.28), ordered by p value. The dot size represents the percentage of cells that express the indicated genes, and the dot color shows the averaged level of expression. FC: fold change. b Correlograms visualizing the correlation of single-cell gene expression profiles between TFs and suppression or proliferation genes in HD PB samples. c FOXP3 protein levels in HD PB Treg cells, 5 days after transfection with FOXP3 overexpression virus, as measured by flow cytometry. Experiment repeated at least three times. d SUB1 protein levels in HD PB Treg cells, 5 days after transfection with SUB1 overexpression virus, as measured by western blot. Experiment repeated three times. e Expression of the mRNA level of indicated genes in HD PB Treg cells, 5 days after transfection with FOXP3 or SUB1 overexpression virus, as measured by RT-qPCR (n = 5–7). Experiment repeated at least three times. f–j Expression of CD25, CTLA4, FGL2, IL10 and KI67 in HD PB Treg cells, 5-6 days after transfection with FOXP3 or SUB1 overexpression virus, as measured by flow cytometry (f, g, i, j) or ELISA (h) (CD25: n = 4, CTLA4: n = 4, FGL2: n = 3, IL10: n = 4, KI67: n = 3). Experiment repeated three times. In e, p values were determined by One-way ANOVA; In f–j, p values were determined by two-sided unpaired t-test; data are presented as mean values ± SEM. Source data are provided as a Source Data file.

