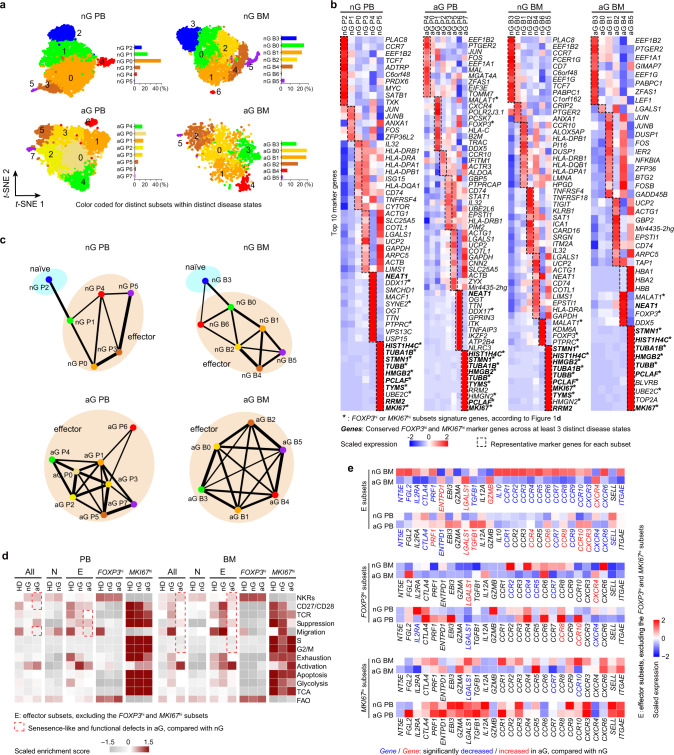
Fig. 6. Treg subsets in allo-HSCT patients with or without aGVHD.
a t-SNE of single-cell transcriptomes of Treg cells from allo-HSCT patients, numbers denote subsets. The insert histograms denote the percentage of each subset within specific patients. nG PB/BM, PB/BM samples from non-aGVHD patients; aG PB/BM, PB/BM samples from aGVHD patients (nG PB: n = 5, nG BM: n = 4, aG PB: n = 6, nG BM: n = 3). b Heatmaps showing the top10 (by fold change) marker genes for each subset, excluding the ribosomal and mitochondrial genes. c Partition graph abstraction (PAGA) analysis. Nodes represent clusters, and thicker edges indicate stronger connectedness between clusters. d Heatmaps showing the GSVA enrichment score of selected pathways for each subset. e Heatmaps showing the expression of migration and suppression-associated genes in different Treg cell subsets. The blue font indicated that the genes were significantly down-regulated in aGVHD patients, compared with non-aGVHD patients (p < 0.05). The red font indicated that the genes were significantly up-regulated in aGVHD patients, compared with non-aGVHD patients (p < 0.05). In e, gene normalized expressions were used and p-values were determined by Wilcoxon rank-sum test. Source data are provided as a Source Data file.

