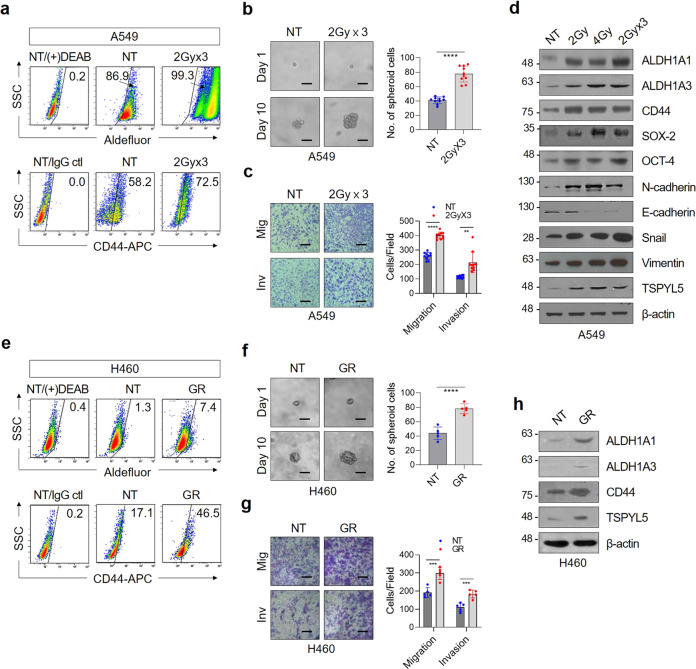
Fig. 1. Fractionated γ-irradiation or gefitinib treatment increases TSPYL5 expression in NSCLC cells.
a Flow cytometric analysis of ALDH1 activity (Aldefluor staining) and CD44 expression (CD44-APC) in A549 cells exposed to fractionated γ-irradiation. Cells were irradiated with a total dose of 2, 4, or 6 Gy (2 Gy × 3) using 60Co γ-ray at a dose rate of 0.2 Gy/min. N,N-diethylaminobenzaldehyde (DEAB)-treated cells or isotype control IgG-stained cells were used as negative controls for gating. Numbers in the upper-right corner represent the percent of positively stained cells. n = 10 independent experiments for each group. b Sphere-formation assay of fractionated γ-irradiation-exposed A549 cells. n = 5. c Migration/invasion assay of fractionated γ-irradiation-exposed A549 cells. n = 5. Scale bar: 20 μm. d Western blot analysis of CSC (ALDH1A1 and A3, CD44, OCT-4, and SOX-2), EMT (N-cadherin, E-cadherin, Snail, and Vimentin) markers, and TSPYL5 in γ-irradiation-exposed A549 cells. CD44 detected with pan-CD44 antibody [CD44 (8E2), CST] corresponds to CD44 standard (CD44s) with molecular weight of about 85 kDa. e Flow cytometric analysis of CSC markers (ALDH1 activity and CD44 expression) in gefitinib-resistant (GR) H460 cells. GR-H460 cells were selected by stepwise escalation of gefitinib from 1 to 10 μmol/L over 4 months. f Sphere-formation assay of GR-H460 cells. n = 5. g Migration/invasion assay of GR-H460 cells. n = 5. h Western blot analysis of CSC markers (ALDH1A1, ALDH1A3, and CD44) and TSPYL5 in GR-H460 cells. Data represent mean ± s.d. using two-tailed t-test. **p < 0.01, ***p < 0.001, ****p < 0.0001.

