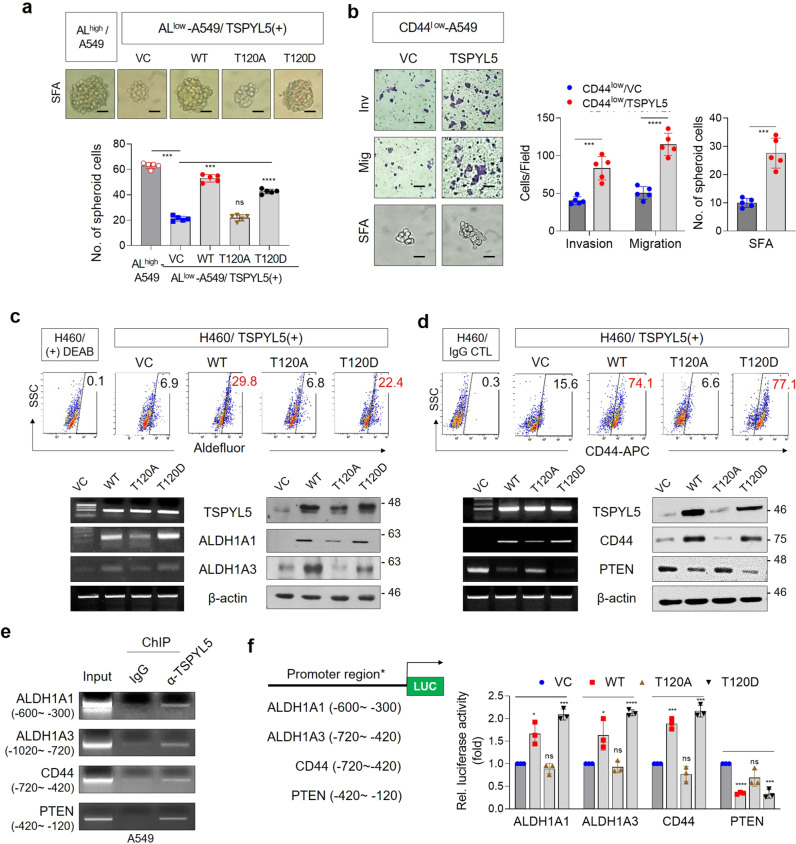
Fig. 7. Phosphorylation of threonine-120 in TSPYL5 is critical for CSC-like characteristics of cancer cells by driving transcriptional activation of CSC-related factors.
a Sphere-formation assay of ALDH1low A549 cells transfected with WT or site-directed mutagenic TSPYL5 expression vectors (T120A and T120D). ALDH1high A549 cells were used as control. n = 5 independent experiments. Scale bar: 20 μm. b Invasion/migration and sphere-formation ability of CD44low cells following transfection with WT-TSPYL5 expression vector. n = 5 independent experiments. c ALDH1A1/A3 expression analyzed by flow cytometric analysis with Aldefluor stainining in H460 cells transfected with non mutagenic (WT: T120) or site-directed mutagenic TSPYL5-expression (T120A or T120D) vectors (upper panel). Sorted cells depending on Aldefluor staining were restained to use as gating controls. RT-PCR and Western blot analysis were also performed (lower panel). d CD44 expression analyzed by flow cytometric analysis with CD44-APC staining in H460 cells transfected with nonmutagenic (WT: T120) or site-directed mutagenic TSPYL5-expression (T120A or T120D) vectors (upper panel). Sorted cells depending on CD44-APC were re-stained to use as gating controls. RT-PCR and Western blot analysis of CD44 and PTEN were also performed (lower panel). e Chromatin immunoprecipitation (ChIP) assays with TSPYL5 antibody evaluating the effect of TSPYL5 on the transcriptional regulation of ALDH1, CD44, and PTEN in A549 cells. PCR for ChIP assay was performed using primers (Supplementary Table 7) positioned between −900 and +120 bp upstream of transcriptional start site of each gene (Supplementary Fig. 8) and representative results were shown. f Luciferase assay evaluating the effect of TSPYL5 on ALDH1, CD44, and PTEN expression in H460 cells transfected with WT or mutagenic TSPYL5-expression vectors (T120A and T120D). Promoter reporter vectors were constructed with specific promoter regions of each gene, which were amplified in ChIP assays as shown in the schematic representation. n = 3 independent experiments. Data represent mean ± s.d. using two-tailed t-test. NS not significant, *p < 0.05, **p < 0.01, ***p < 0.001, ****p < 0.0001.

