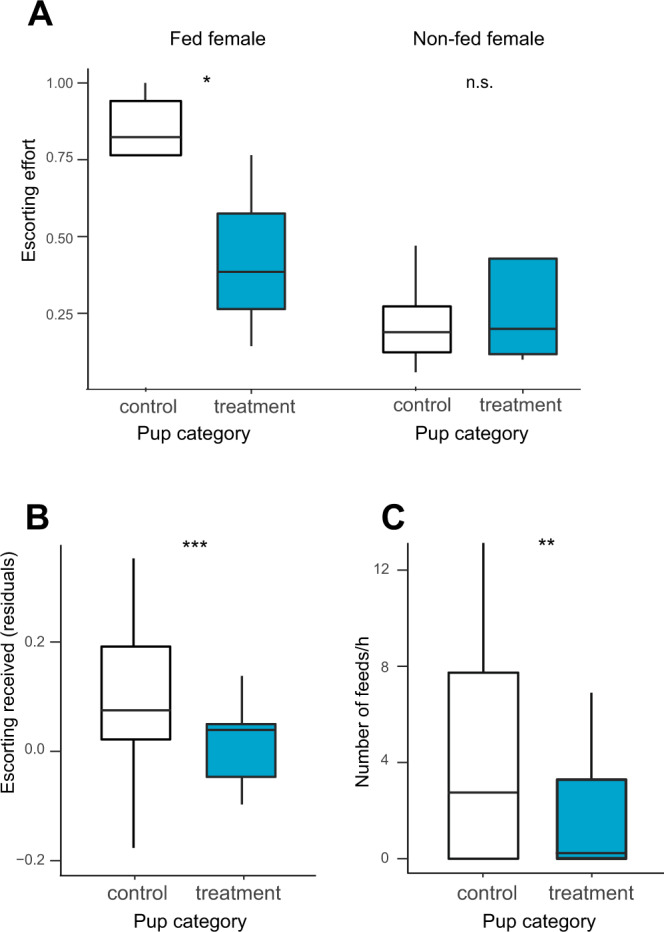
Fig. 3. Pattern of postnatal care.

A Escorting effort (proportion of time spent escorting) directed to control (unshaded) and treatment (sky blue) pups by fed females and non-fed females. B Overall escorting received by control and treatment pups (residual values plotted once other variables are controlled for in our statistical model, Table S6). C Rates at which the control and treatment pups were fed by their escort. Boxes show the interquartile range (IQR) and median (internal horizontal line). Whiskers (vertical lines) show the extent of observations outside the IQR to a maximum of 1.5x IQR. Other legends: n.s.: p > 0.05; *p < 0.05; **p < 0.01; ***p < 0.001.
