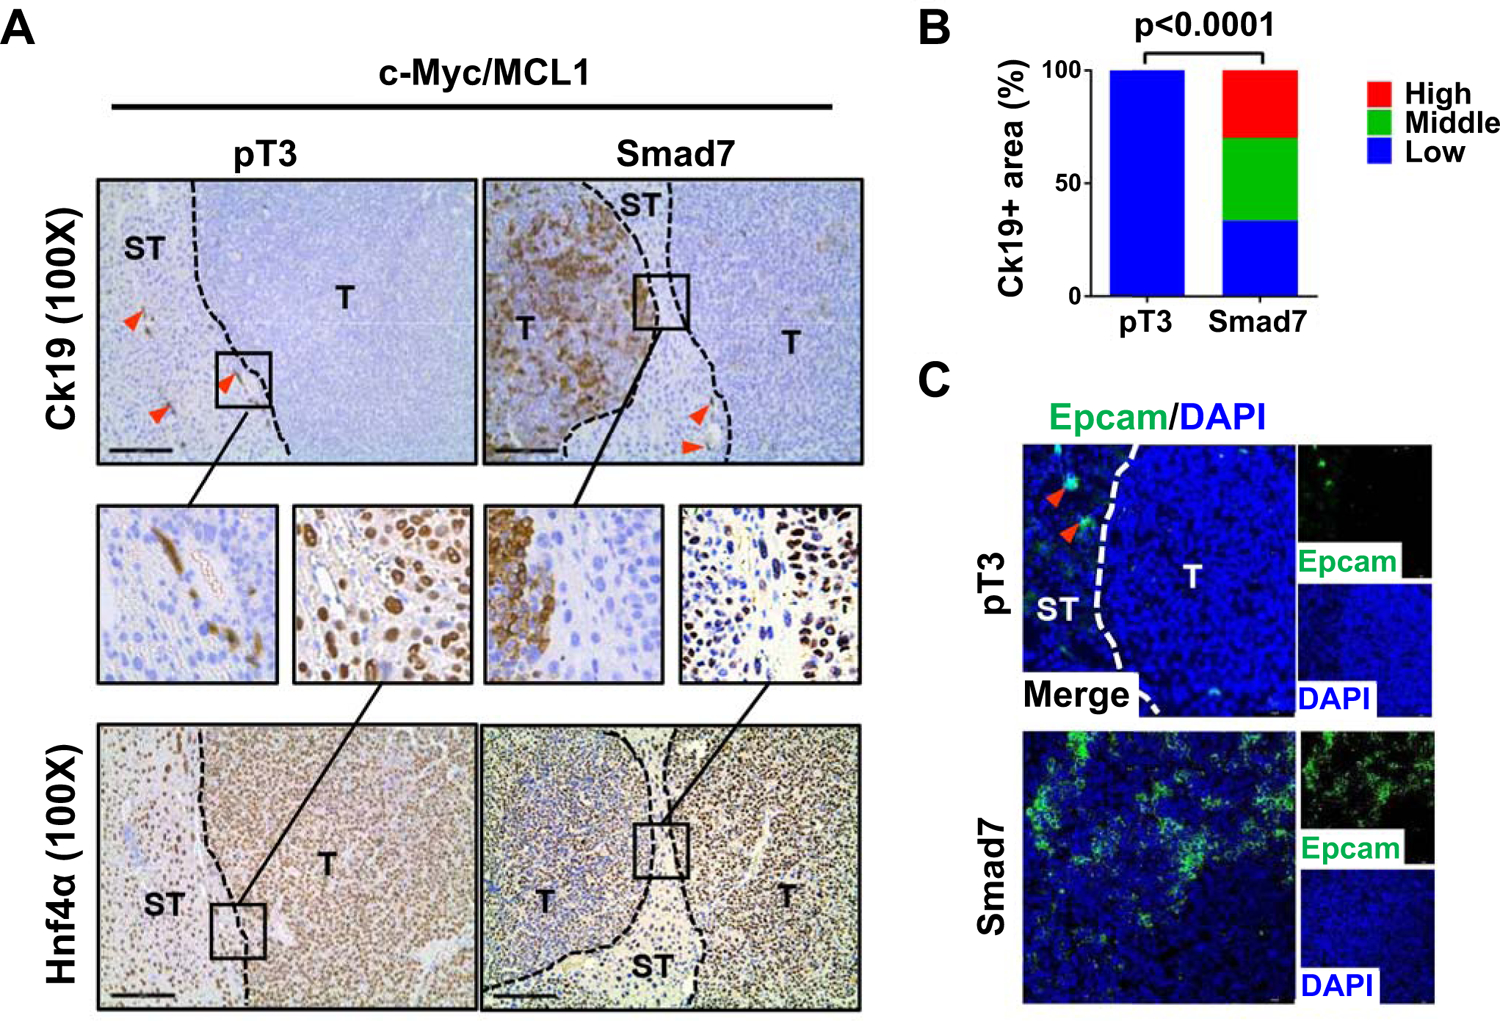
Fig. 4. Smad7 induces Ck19 positive cells in c-Myc/MCL1 mouse HCCs.

(A) Representative immunohistochemical staining images of cholangiocyte marker (Ck19) and hepatocyte marker (Hnf4a). Red arrows indicate Ck19 positive stained intrahepatic biliary cells. T: tumor, ST: Surrounding tissue. Small black boxes inside figures indicate areas of interest, large black boxes linked by black line denote enlarged views for better visualization. Original magnification: 330X. Scale bar: 200μm. (B) Percentages of Ck19 high/medium/low expression areas in tumor samples. (C) Representative immunofluorescence staining images of Epcam in c-Myc/MCL1/pT3 and c-Myc/MCL1/Smad7 mouse liver tissues. Red arrows indicate Epcam positive stained intrahepatic biliary cells. Scale bars: 50 mm.
