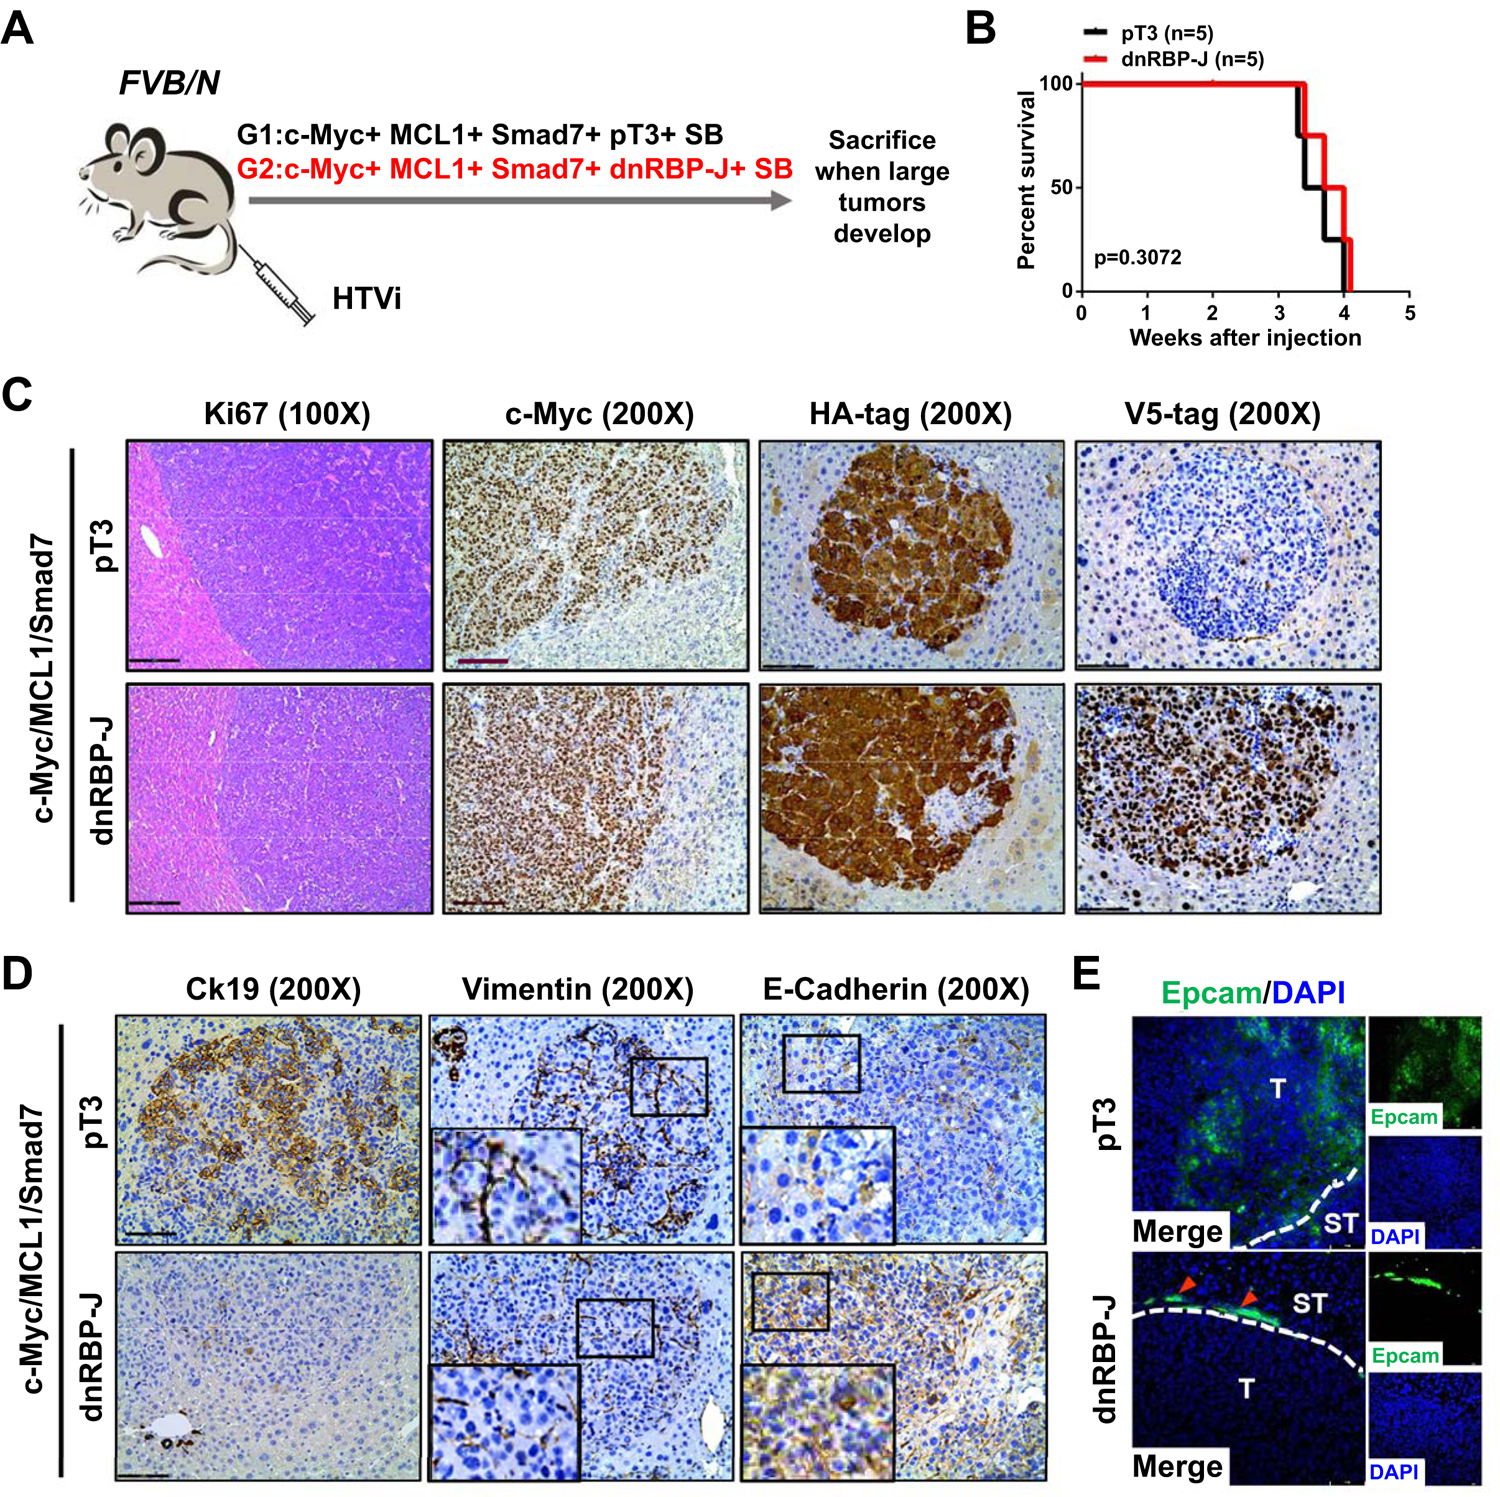
Fig. 5. Blockade of the Notch signaling does not affect c-Myc/MCL1/Smad7 driven mouse HCC development.

(A) Study design. FVB/N mice were injected with c-Myc/MCL1/Smad7/pT3/SB (N=5) or c-Myc/MCL1/Smad7/dnRBP-J/SB (N=5) plasmids, respectively. Mice were monitored and sacrificed when moribund. (B) Survival curve showing that suppression of the Notch signaling does not prolong c-Myc/MCL1/Smad7 mouse survival. (C) Representative H&E and immunohistochemical staining images of c-Myc, HA-tag and V5-tag in both groups. Scale bars: 200 μm for 100X, 100μm for 200X. (D) Representative immunohistochemical staining images of Ck19, Vimentin, and E-cadherin in both groups. Small black boxes inside figures indicate areas of interest, large black boxes on left lower corner denote enlarged views for better visualization. Magnification: 1000X. Scale bar: 100μm. (E) Representative immunofluorescence staining images of Epcam in both groups. Red arrows indicate normal bile duct cells. Scale bar: 50 μm, Abbreviations: H&E, hematoxylin and eosin; HTVi, hydrodynamic tail vein injection.
