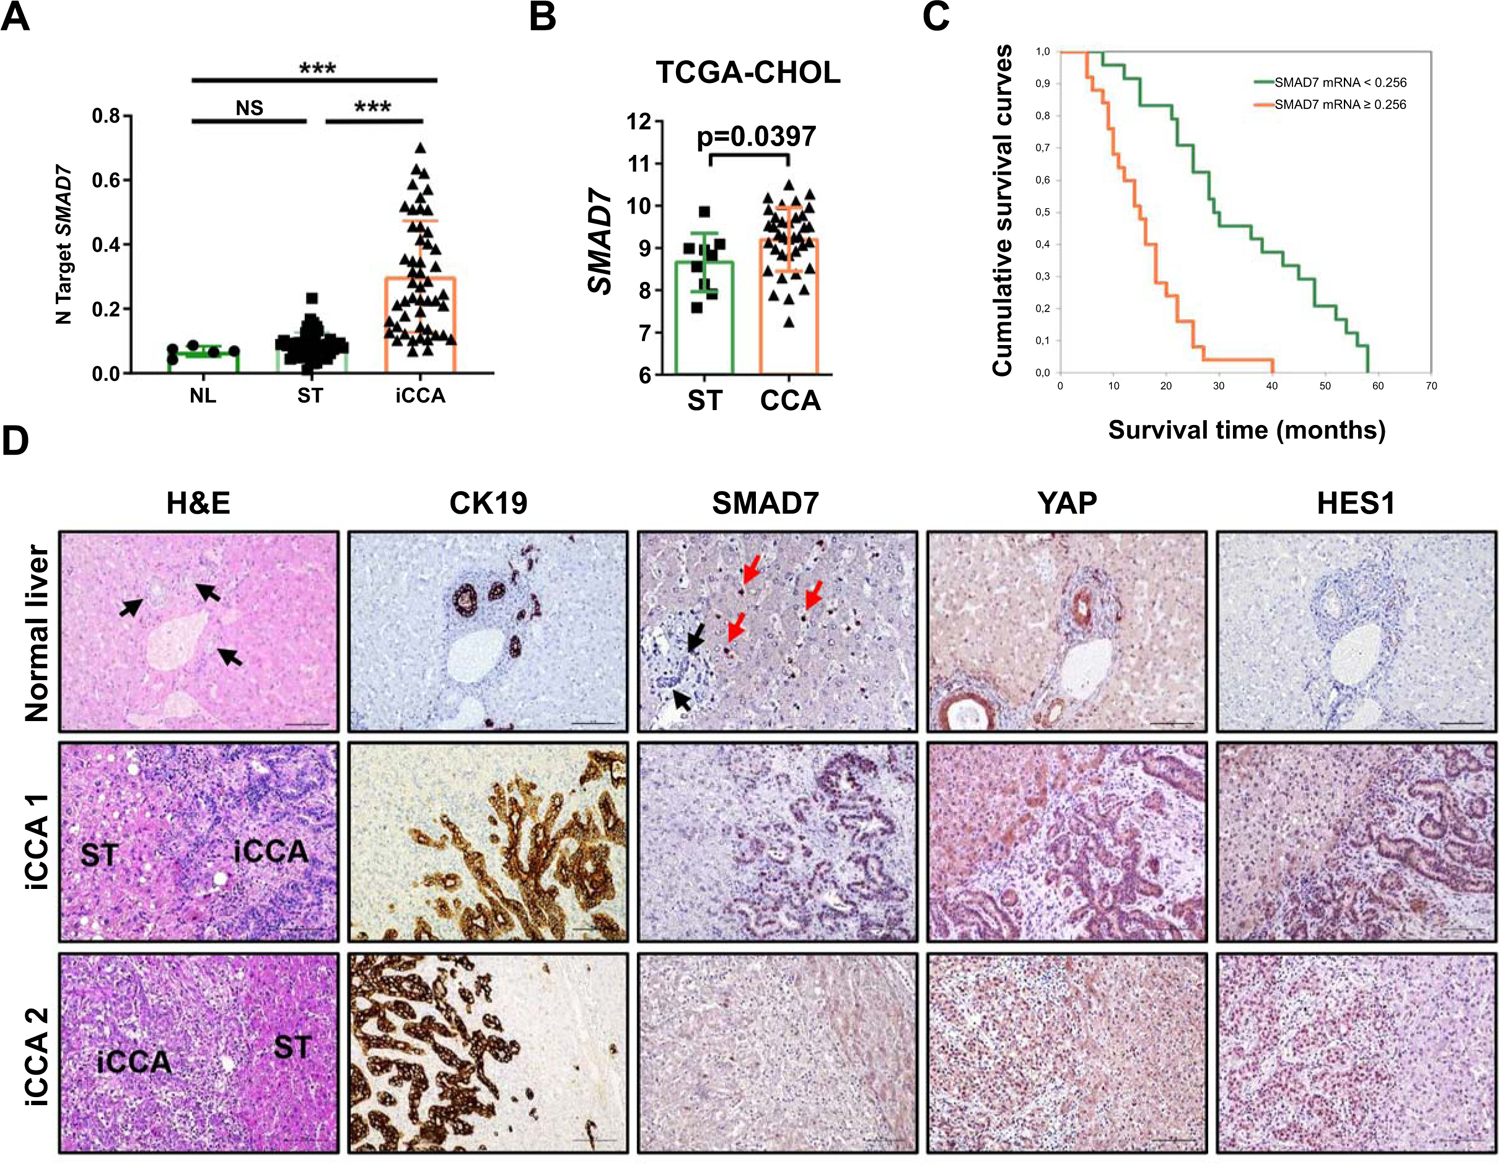
Fig. 7. SMAD7 and its downstream effectors are overexpressed in human intrahepatic cholangiocarcinoma (iCCA) specimens.

(A) Quantitative real-time RT-PCR analysis of SMAD7 mRNA levels in normal livers (n = 5), iCCA (n = 50), and corresponding non-tumorous surrounding liver tissues (ST; n = 50). Quantitative values were calculated by using the PE Biosystems Analysis software and expressed as number target (N Target). N Target = 2−ΔCt, wherein the ΔCt value of each sample was calculated by subtracting the average Ct value of the SMAD7 gene from the average Ct value of the β-Actin gene. P-value was calculated using Mann–Whitney U test. *** P < 0.0001 when compared to Normal Liver (NL); *** P < 0.0001 when compared to Normal liver (NL) and Surrounding Tissue (ST). Abbreviation: NS, not significant. (B) SMAD7 expression in non-tumorous surrounding liver tissues (ST; n = 9) and cholangiocarcinoma tumor tissues (CCA; n = 36) from the TCGA CHOL cohort. (C) Kaplan–Meier survival curve of human iCCA with high and low SMAD7 mRNA levels, showing the unfavorable outcome of patients with elevated expression of this gene. (D) Representative immunohistochemical patterns of SMAD7 and YAP and NOTCH (HES1) downstream effectors in normal livers and two human intrahepatic cholangiocarcinoma specimens (iCCA 1 and 2). In normal liver, bile ducts composed of cholangiocytes (indicated by black arrows and being positive for CK19, YAP, and HES1 immunoreactivity) as well as normal hepatocytes display the absence of SMAD7 staining. Immunoreactivity for SMAD7 is limited to stellate cells (indicated by red arrows). Equivalent results were detected in non-tumorous surrounding liver tissues (not shown). In contrast, iCCA 1 exhibits concomitantly strong nuclear staining for SMAD7, YAP, and HES1 proteins, whereas weak/absent immunoreactivity is displayed by the non-tumorous surrounding counterpart (ST). iCCA 2 shows instead weak nuclear staining for SMAD7, limited to few tumor cells, whereas YAP and HES1 proteins display strong nuclear immunoreactivity. The CK19 staining was used as a marker of biliary differentiation of the tumors. Original magnification: 200X or 400x (for SMAD7 in normal liver); scale bar: 100 μm or 50 μm (for SMAD7 in normal liver). Abbreviation: H&E, hematoxylin and eosin staining.
