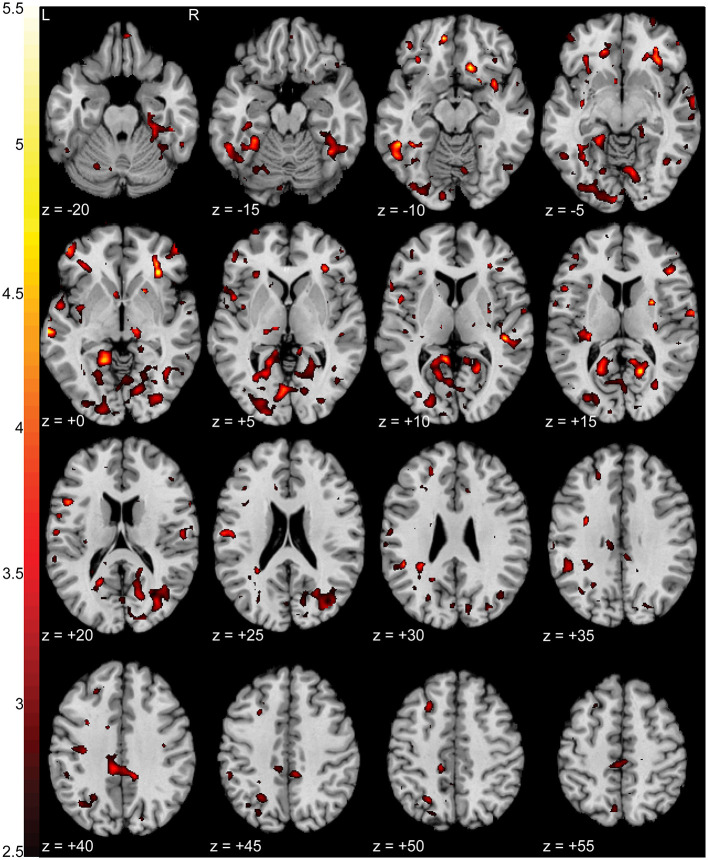
Figure 5.
Increased activation in NP subjects during the pain focus state compared to the non-pain focus state. T-statistic mapping of increased BOLD activation (p < 0.05 uncorrected) during the pain focus state when compared to the non-pain focus state in the NP subject group. Increased activity was seen bilaterally in precuneus, anterior insula, middle temporal gyrus, middle cingulate cortex, and orbitofrontal cortex, and unilaterally in the left lingual gyrus. Clusters fewer than 10 contiguous voxels were filtered for clarity. The difference between axial slices is 5 mm and z-values are relative to the AC/PC plane.

