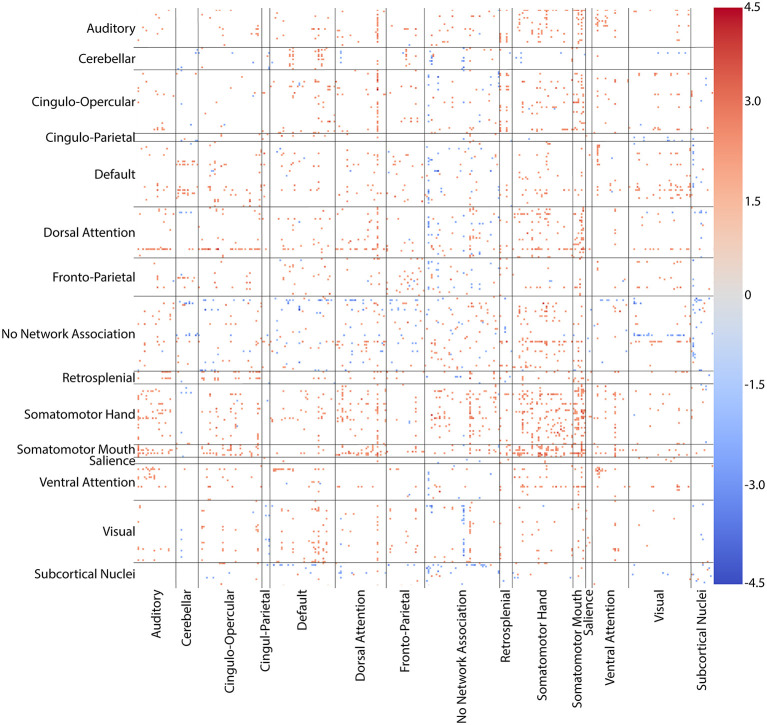
Figure 6.
Connectivity matrix of regions with altered connectivity between NP and control groups. T-statistic values for whole-brain, all-to-all comparisons between groups for the 361 ROI combined cortical, subcortical, and cerebellar parcellation. Somatomotor hand, somatomotor mouth, and dorsal attention networks showed widespread increases in connectivity with nearly every other network. Hyperconnectivity was particularly dense in somatomotor-somatomotor connections. Only connections with differences at p < 0.05 uncorrected are colored. Warm colors (reds) indicate an increase in connectivity in the NP group when compared to controls. Cool colors (blues) indicate a decrease in the NP group.

