
FIGURE 3.
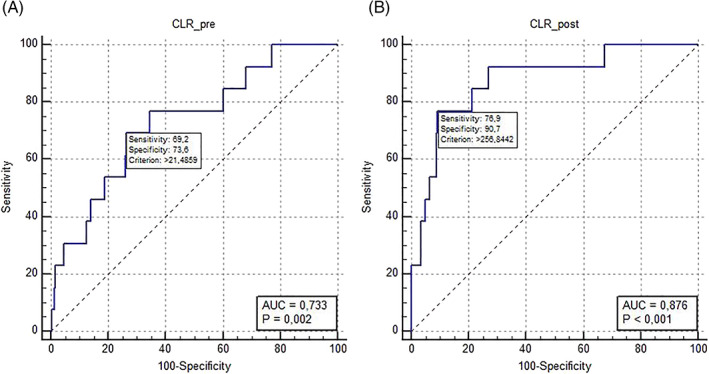
The ROC curves of the CLR in the preoperative and postoperative periods were compared for the predictive power of in‐hospital mortality with A and B. Abbreviations: AUC, area under the curve; CLR_post, the ratio of C‐reactive protein to lymphocyte count value in the postoperative period; CLR_pre, the ratio of C‐reactive protein to lymphocyte count value in the preoperative period; ROC curve, receiver operating characteristic curve