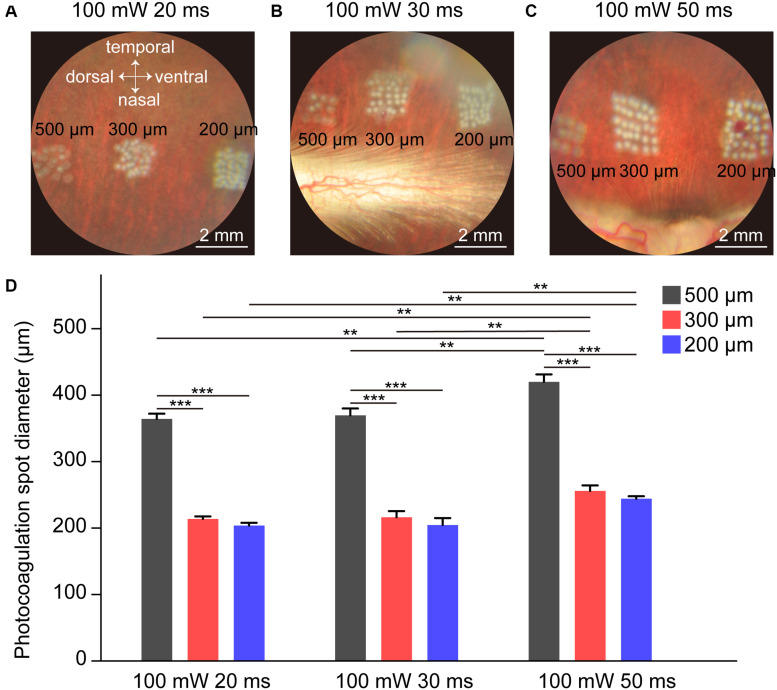
FIGURE 1.
Fundus images of rabbit retina under different photocoagulation conditions 1 h after surgery. (A–C) Fundus images of retina after photocoagulation of 200, 300, and 500 μm laser spot size produced by 100 mW laser power and 20 (A), 30 (B), or 50 ms (C) pulse duration. Scale bar = 2 mm. (D) Lesion diameter on retina by photocoagulation with 200, 300, or 500 μm laser spot size produced by 100 mW laser power and 20, 30, or 50 ms duration (number of spots: n20 ms/500 μ m = 9, n20 ms/300 μ m = 15, n20 ms/200 μ m = 15, n30 ms/500 μ m = 10, n30 ms/300 μ m = 15, n30 ms/200 μ m = 15, n50 ms/500 μ m = 9, n50 ms/300 μ m = 15, n50 ms/200 μ m = 14, Each set of spots comes from one retina). Data were presented as Mean ± SEM. **P < 0.01, ***P < 0.001.

