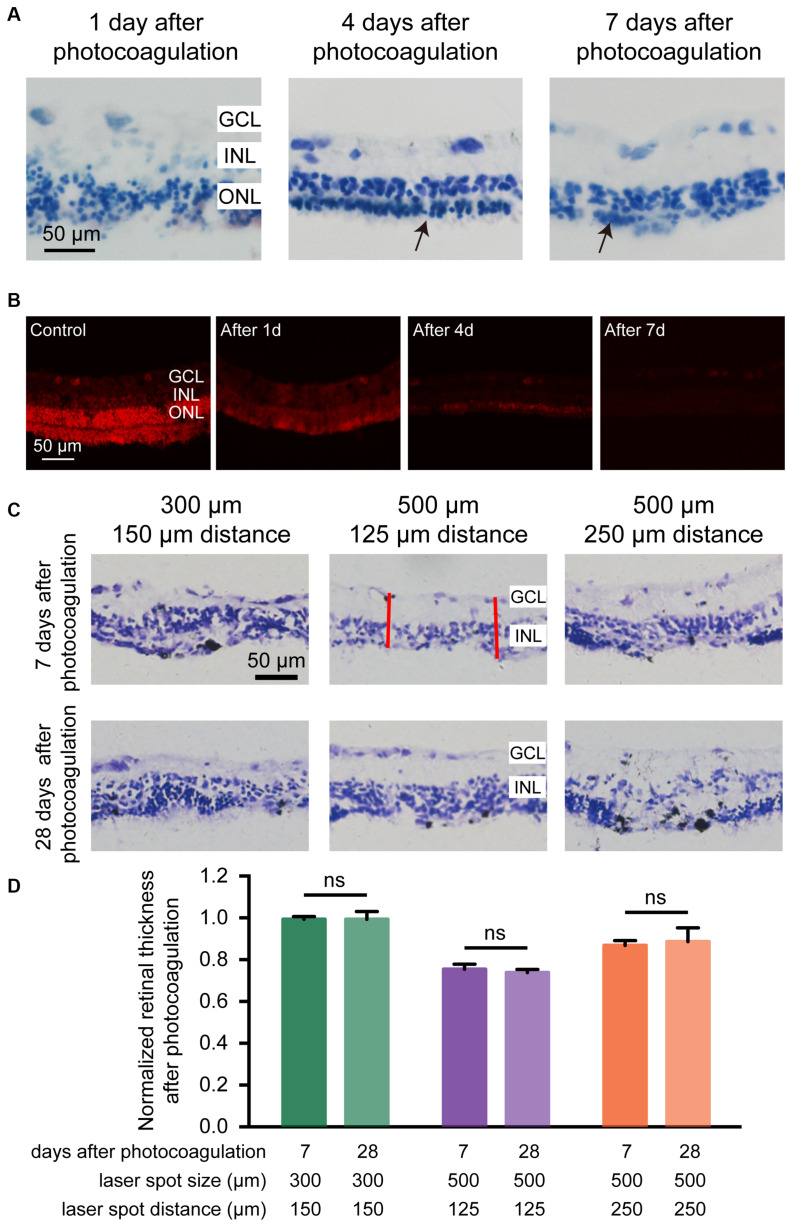
FIGURE 4.
Histomorphology of rabbit retinas and normalized retinal thickness after photocoagulation surgery. (A) Histologic images at 1, 4, and 7 days after photocoagulation with 100 mW laser power and 50 ms pulse duration. Histologic images for 500 μm laser spot size and 0 μm laser spot distance. The arrow points to the remnant cells of the ONL. Scale bar = 50 μm. (B) DHE staining of control retinal sections and local damage retinal sections at 1, 4, and 7 days after photocoagulation with 100 mW laser power and 50 ms pulse duration. Stained images for 500 μm laser spot size and 0 μm laser spot distance. Scale bar = 50 μm. GCL, ganglion cell layer; INL, inner nuclear layer; ONL, outer nuclear layer. (C) Histologic sections of rabbit retinas 7 and 28 days after photocoagulation with 100 mW laser power and 50 ms pulse duration. Histologic images for 300/150, 500/125, and 500/250 μm laser spot size/distance. GCL, ganglion cell layer; INL, inner nuclear layer. Scale bar = 50 μm. The red line represents two locations randomly taken in each section for measuring the thickness of the retina after photocoagulation in the photocoagulation area. (D) Normalized photocoagulation retinal thickness in different sections at 7 and 28 days after photocoagulation under the same conditions as in (A). Normalized retinal thickness is the ratio between retinal thickness in photocoagulation area and retinal thickness in nonphotocoagulation area. (7 days after photocoagulation: n300/150 μ m = 8 slices, n500/125 μ m = 8 slices, n500/250 μ m = 6 slices; 28 days after photocoagulation: n300/150 μ m = 5 slices, n500/125 μ m = 6 slices, n500/250 μ m = 4 slices). Data were presented as Mean ± SEM.

