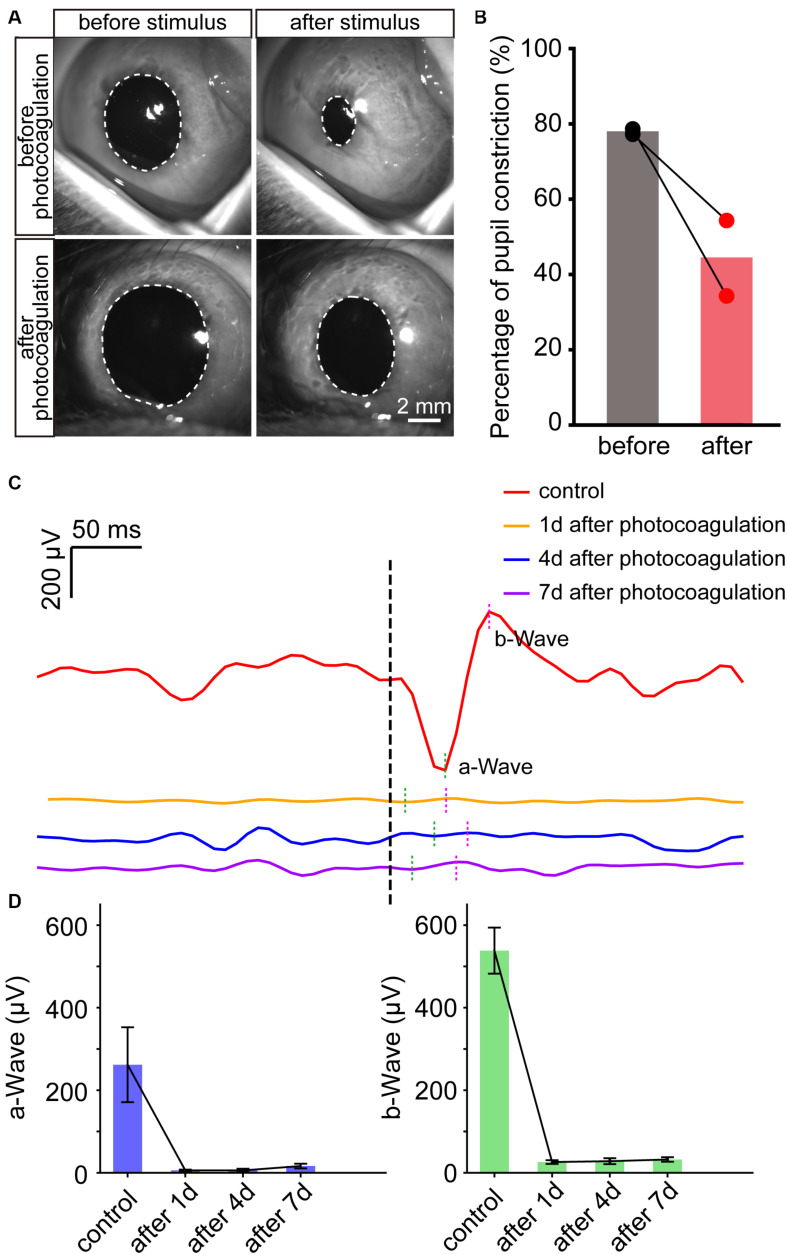
FIGURE 6.
The change of pupillary light reflex and ERG in rabbits before and after photocoagulation. (A) The example images of pupillary direct light reflex before (top row) and 3 days after photocoagulation (bottom row) of the same rabbit eye. The position of the white dotted circle is the pupil position. Scale bar = 2 mm. (B) Pupil constriction ratio before and 3 days after photocoagulation of rabbits. The pupil constriction ratio is calculated as (S0-Smin) / S0 × 100%, Smin is the minimum pupil area under light stimulation, and S0 is the pupil area of the frame before light is given. (C) Sample waveforms of ERG before photocoagulation, 1, 4, and 7 days after photocoagulation. (D) Comparison of a- and b-wave amplitudes in eyes before photocoagulation and 1, 4, and 7 days after photocoagulation.

