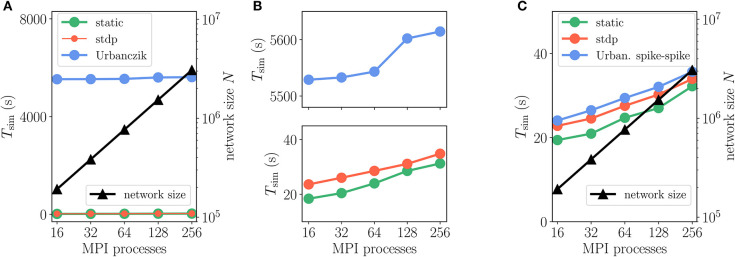
Figure 12.
Scaling of simulation times Tsim with network size for 2 s of biological time: Urbanczik-Senn plasticity. Same weak scaling as in Figure 10. (A) Event-driven Urbanczik-Senn rule (blue) compared to static (green) and STDP synapse (red). On the scale of the vertical axis the red curve (STDP synapses) falls on top of the green curve (static synapses), indicated by finer line width and marker size of the former. (B) Same simulation time data as in (A) but with a smaller range on the vertical axis. Upper panel: enlargement of Urbanczik-Senn data. Lower panel: enlargement of data for static and STDP synapses. (C) Spike-spike version of the Urbanczik-Senn rule compared to static and STDP synapse. Network and simulation parameters as in Supplementary Table 5 with in-degree K = 5, 000. For all simulations each compute node runs one MPI process with 24 threads.

