Figure 7.
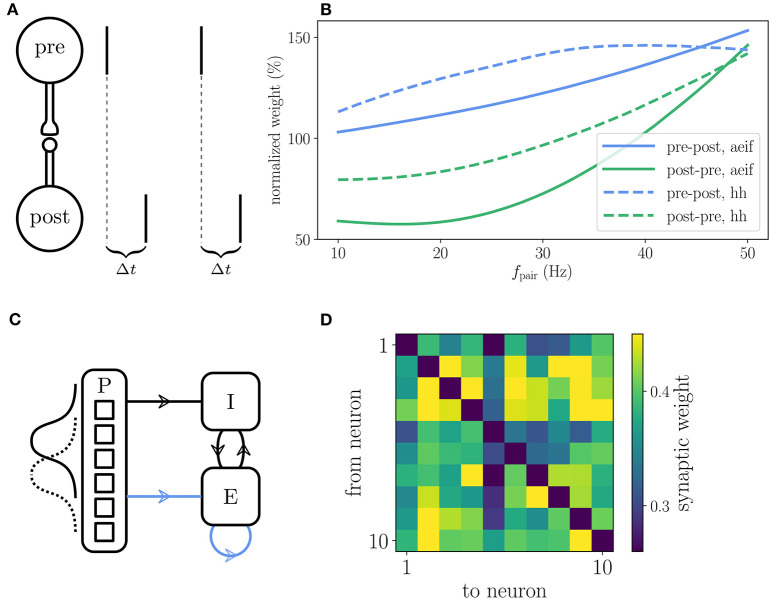
Reproduction of results with Clopath rule. (A) Setup of the spike pairing experiment. Two neurons (“pre” and “post”) that are connected by a plastic synapse receive input so that they spike one after another with a delay Δt. The change of the synaptic weight is computed according to the Clopath rule as a function of the frequency fpair with which the spike pairs are induced. (B) Result of the spike pairing experiment. The relative change of the synaptic weight after five spike pairs as a function of fpair is shown for two different neuron models (aeif: solid curves, Hodgkin-Huxley: dashed curves). The blue curves represent a setup where the postsynaptic neuron fires after the presynaptic one (pre-post, Δt = 10 ms) and the green curves represent the opposite case (post-pre, Δt = −10 ms). This panel corresponds to Figure 2B of Clopath et al. (2010). (C) Setup of the network that produces strong bidirectional couplings. The network consists of an inhibitory (I) and an excitatory (E) population which receive Poisson spike trains (P) as an external input. The firing rate of the latter is modulated with a Gaussian shape whose center is shifted every 100 ms. The external input connections to the excitatory population are plastic as well as the connections within the excitatory population (indicated by blue arrows). (D) Synaptic weights of the all-to-all connected excitatory neurons after the simulation of the network. Strong bidirectional couplings can be found, e.g., between neurons 2 and 3, 2 and 9, and 4 and 7. The setup of this experiment is similar to that shown in Figure 5 of Clopath et al. (2010). A more detailed description of the two experiments can be found in Appendix Section 5.4.

