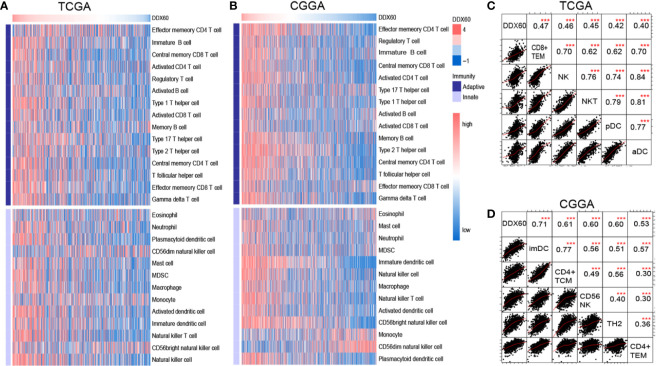
Figure 6.
DDX60 is closely correlated with immune cells in the glioma microenvironment. (A, B) Heatmap based on TCGA and CGGA dataset visualizing the relationship between DDX60 and 28 infiltrating immune cell populations. (C, D) Correlation matrixes of the top five most related immune cells with DDX60 in TCGA and CGGA datasets. ***P < 0.001.

