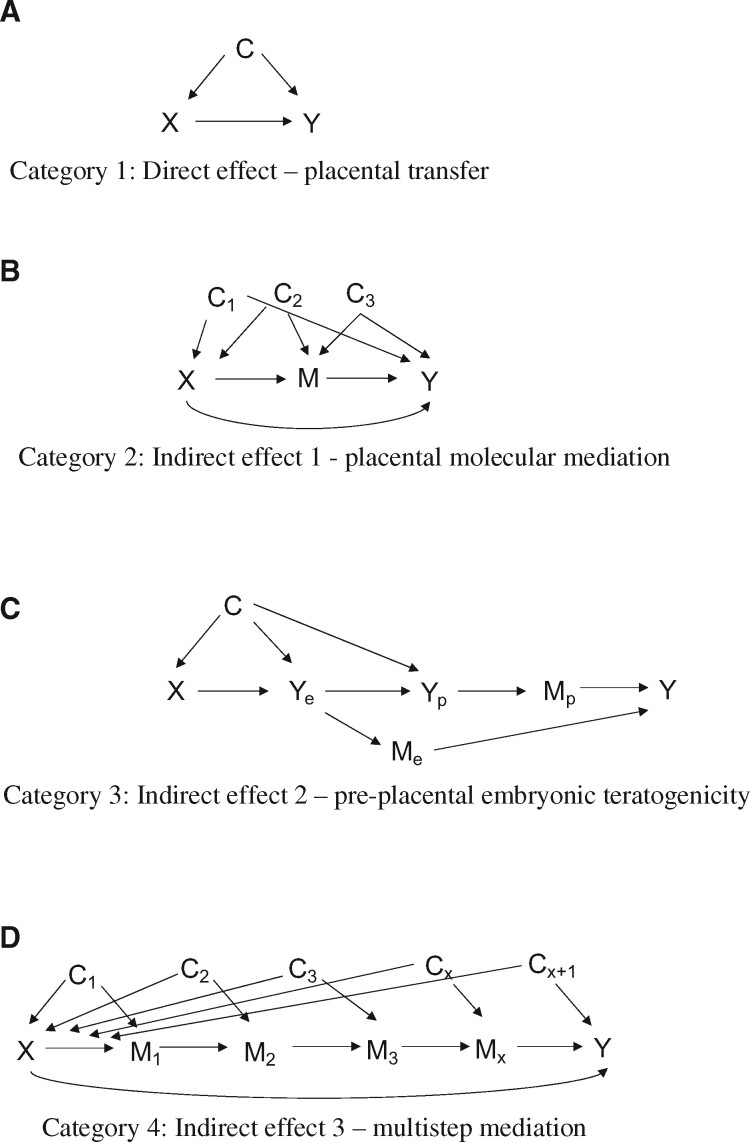
Figure 3.
Four directed acyclic graphs to guide the analysis of first trimester teratogens, biomarkers and child outcomes. (A) The directed acyclic graph for direct effects. (X: prenatal exposure, Y: foetal outcome, C: set of confounders). (B) The directed acyclic graph for placental molecular mediation (indirect effects). (X: prenatal exposure, M: placental mediator/biomarker, Y: foetal outcome, C1,2,3: set of confounders). (C) The directed acyclic graph for pre-placental embryonic teratogenicity. (X: pre-conception/prenatal exposure, Ye: embryo outcome, Yp: extraembryonic/placental outcome, C: set of confounders, Mp: extraembryonic/placental secreted biomarker, Me: embryonic secreted biomarker). (D) The directed acyclic graph for multi-step mediation. (X: prenatal exposure, M1…x: mediator/biomarker, Y: foetal outcome, C1…X+1: set of confounders).

