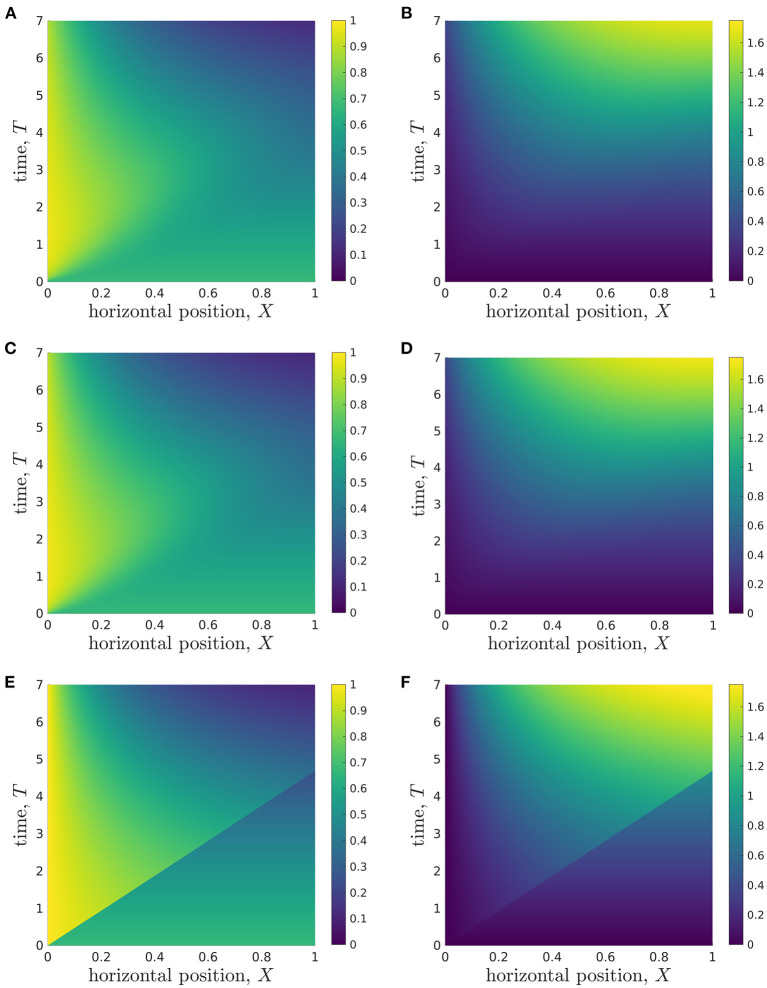
Figure 4.
Results showing how the glucose (A,C,E) and lactate (B,D,F) concentrations change over time during a typical simulation. (A,B) Results from Z-averaged full model. (C,D) Longwave approximation. (E,F) Sublimit of longwave approximation, where the upper left and lower right regions are the replenished and unreplenished regions, respectively. Parameter values: see Table 3.

