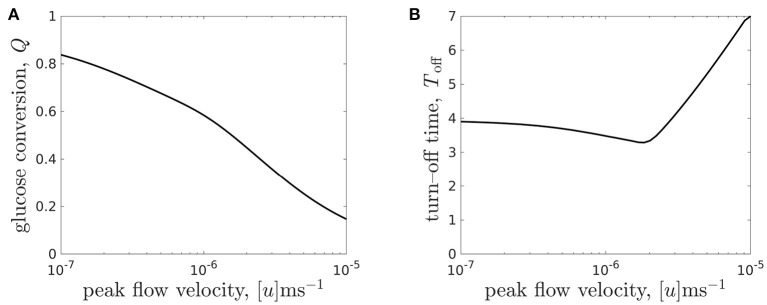
Figure 9.
(A) Glucose conversion Q, Equation (3.3), at time T = 7 and (B) turn-off time Toff (the time when intolerable lactate levels first experienced) for the CXP1 bioreactor varying with flow rate, for a given organoid line. Peak flow velocities [u] ∈ [10−7, 10−5]m s−1 correspond to dimensionless flow rate, μ, in the range μ ∈ [0.096, 9.6] and the other parameter values are given in Table 3.

