FIGURE 10.
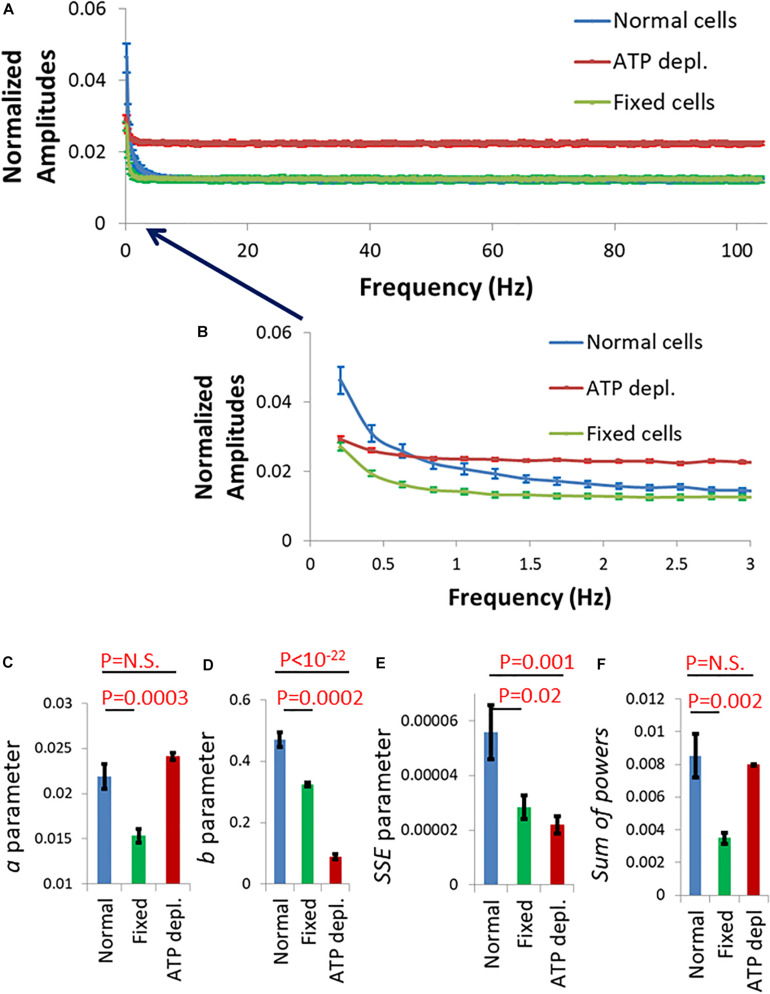
Fluctuation of Jurkat cell membrane in a model of the immune synapse imaged by TIRF microscopy. (A) Discrete Fourier Transform (DFT) results of fluctuations of normalized intensity of anti-CD45 antibodies labeled with Alexa647, which highlighted the plasma membrane of Jurkat cells. The cells adhered to coverslips coated with anti-CD3ε. Amplitudes of normal cells (N = 30) are in blue, adenosine triphosphate (ATP) depleted cells (N = 33) are in red and fixed cells (N = 24) are in green. (B) Frequency range of 0–3 Hz of the amplitudes in (A). Power fit parameters: a (C), b (D), sum of squared errors (SSE) (E), and Sum of powers (F) results of the amplitudes presented in (B). Error bars in panels (A–F) are SEM.

