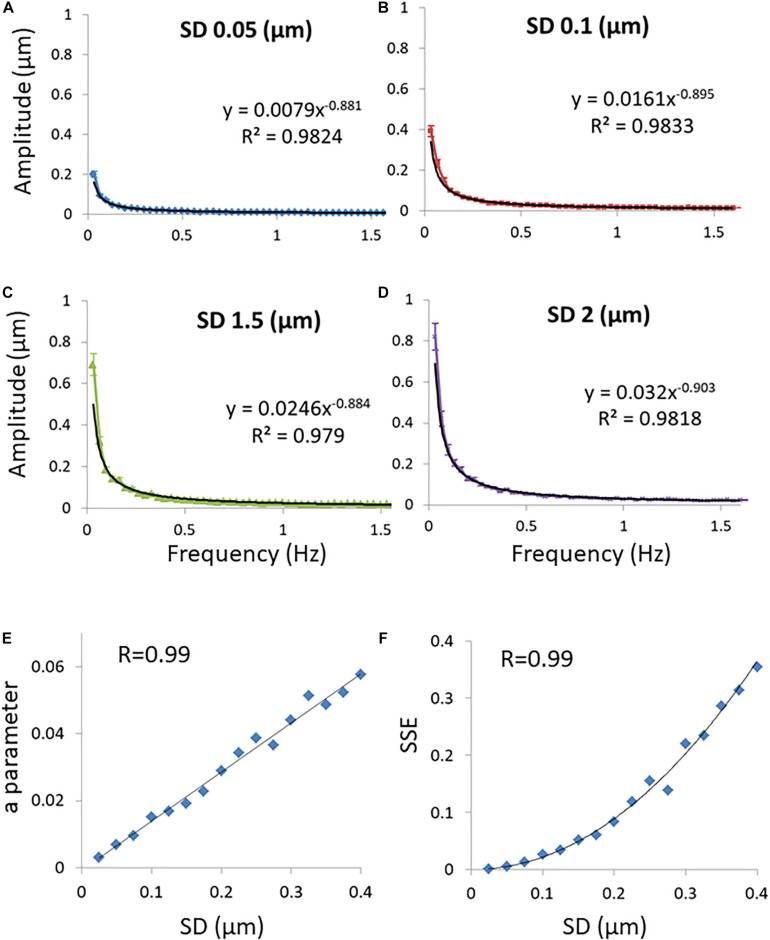
FIGURE 2.
Simulations results. (A) Discrete Fourier Transform (DFT) of a simulated particle position change in time when the probability density function’s (PDF) of translocations are Gaussian and the SD of translocations is 0.05 μm. Power fit parameters of the DFT results are added. (B) The same as (A) except that the SD of translocations is 0.1 μm. (C) The same as (A) except that the SD of translocations is 0.15 μm. (D) The same as (A) except that the SD of translocations is 0.2 μm. 50 simulations were performed for each condition described in panels (A–D). (E) The correlation between the SD of translocations and the a parameter of the power fit results (y = axb) in each condition of SD. (F) The correlation between the SD’s of translocations and the sum of squared errors (SSE) of the power fit in each condition of SD. Error bars in panels (A–D) are SEM.

