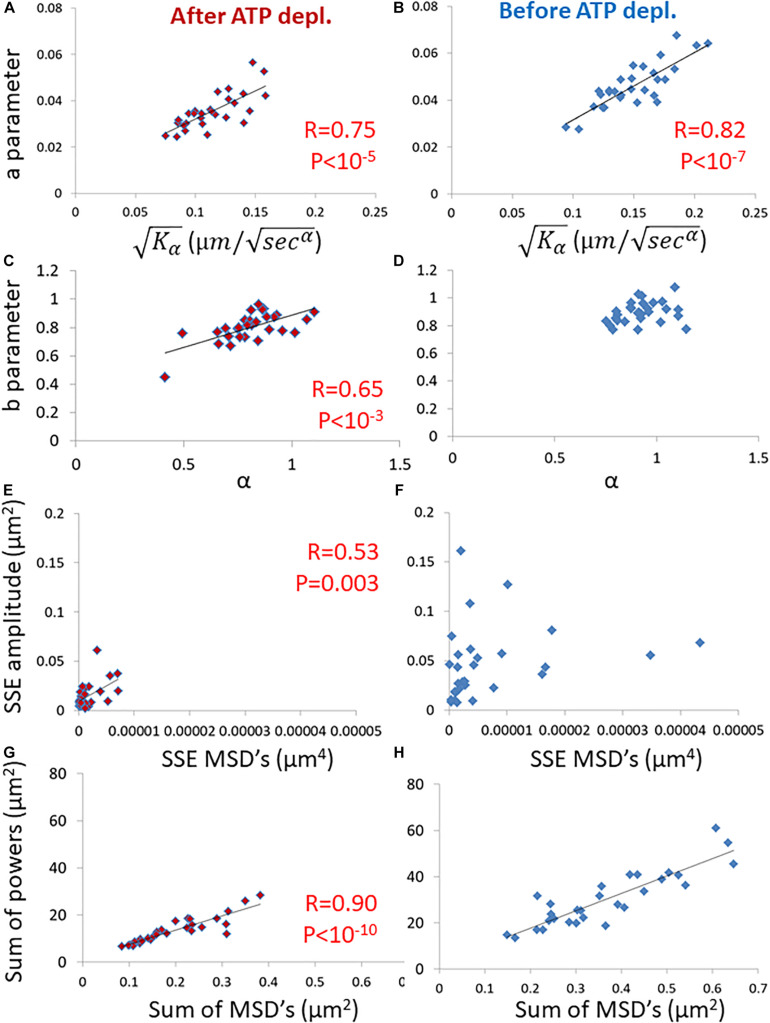
FIGURE 4.
Correlation of amplitude spectral density (ASD)/ power spectral density (PSD) parameters and mean square displacement (MSD) parameters in live cells before and after adenosine triphosphate (ATP) depletion. (A) The correlation between the a parameter of ASD analysis and of MSD analysis in ATP-depleted cells. Analyses relate to DIC microscopy results of intracellular particles motion of shown in Figure 3 (n = 29). (B) The correlation between the a parameter of ASD analysis and of MSD analysis in cells before ATP depletion. (C) The correlation between the b parameter of ASD analysis and α of MSD analysis in ATP depleted cells. (D) The correlation between the b parameter of ASD analysis and α of MSD analysis in cells before ATP depletion. (E) The correlation between the SSE parameter of ASD analysis and SSE of power fit to MSD analysis in ATP depleted cells. (F) The correlation between the SSE parameter of ASD analysis and the sum of squared errors (SSE) of power fit to MSD analysis in cells before ATP depletion. (G) The correlation between “Sum of powers” parameter of PSD analysis and sum of MSD’s parameter (from MSD analysis) in ATP depleted cells. (H) The correlation between “Sum of powers” parameter of PSD analysis and sum of MSD’s parameter (from MSD analysis) in cells before ATP depletion. R- and P-values of significant correlations are presented in the corresponding correlations images.

