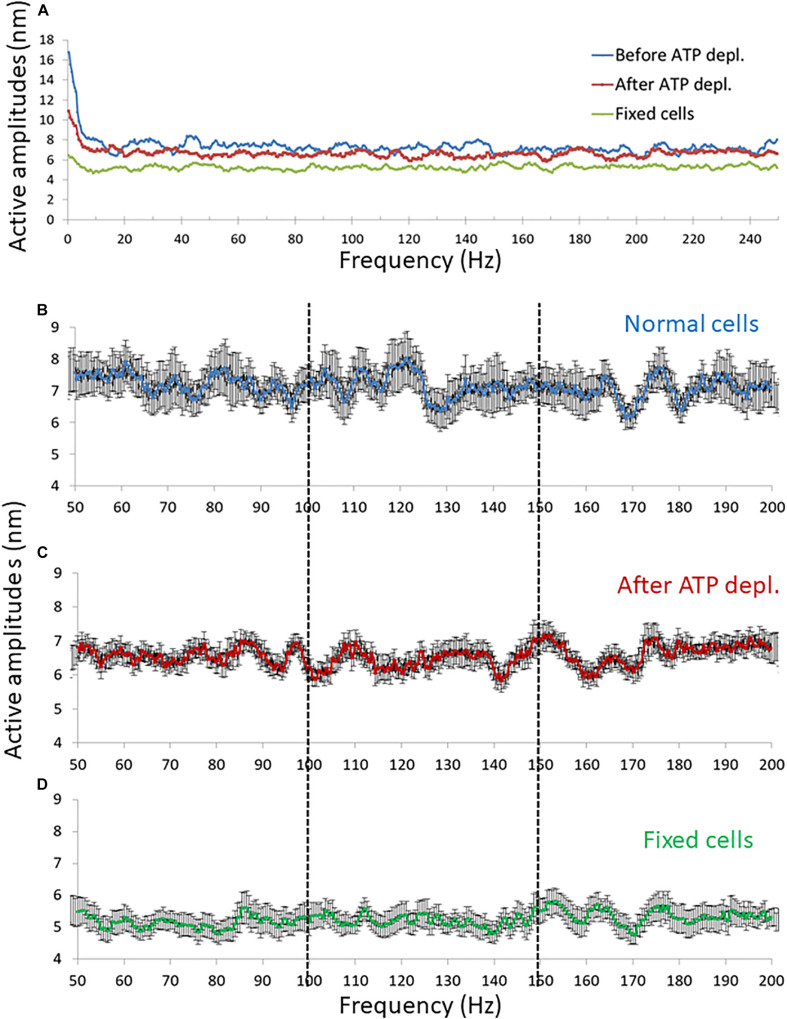
FIGURE 8.
Amplitude spectral density (ASD) results in high frequencies (>50 Hz). (A) Average ASD results in normal non-treated cells (N = 14), adenosine triphosphate (ATP) depleted cells (N = 14) and dead fixated cells (N = 20). (B–D) Average ASD results in the frequencies range between 50 and 200 Hz in normal non-treated cells (B), ATP depleted cells (C), and fixated dead cells (D). Error bars in panels (B–D) are SEM.

