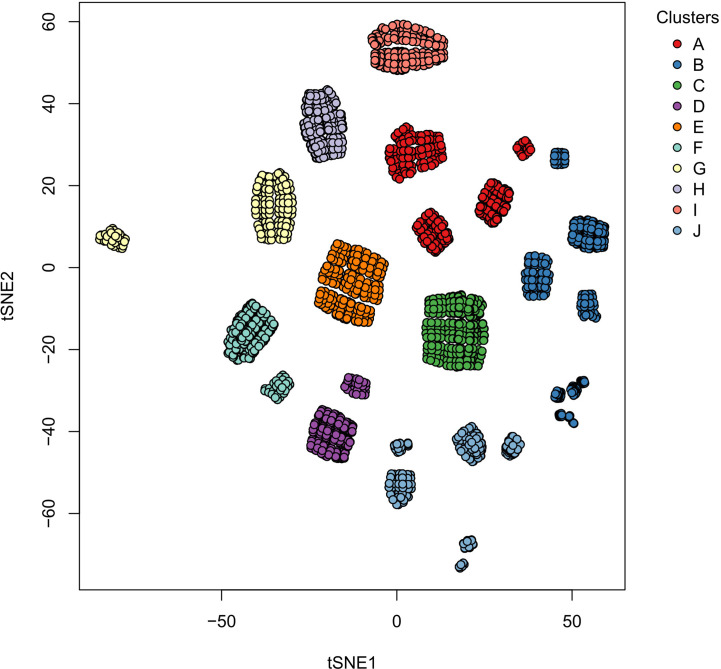
Figure 2.
Clusters of the single size attractors obtained in the Boolean simulations. Each circle represents a two-dimensional projection of one attractor, and the color represents a collection of attractors with similar phenotypes between them. The numbers associated with the clusters are explained in Table 1.

