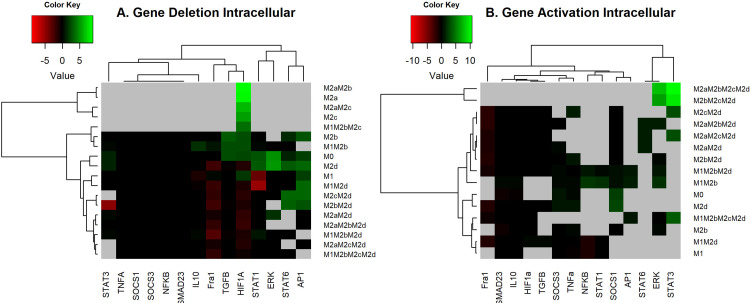
Figure 3.
Heat Map of the overexpression and knock-out of transcriptional factors. (A) Heat Map of the overexpression of transcriptional factors of macrophage polarization. We maintained the expression of the node as 1, simulated, and reviewed the attractors obtained. All overexpression was compared with the wild-type (original network) with log2 fold change. (B) Heat Map of Knock-outs of transcriptional factors of macrophage polarization. The nodes were permanently fixed with a value of 0; the perturbations were realized one by one until the attractors were reached. We compared the phenotypes of the wild-type with the perturbations by a log-fold change. Green and red regions indicate those attractors whose size of the basin of attraction increased or decreased after the perturbation. In black, we denote those attractors with few effects in the basin attraction size versus WT and after perturbation. Gray areas indicate those attractors that exist in the wild-type but do not remain perturbed.

