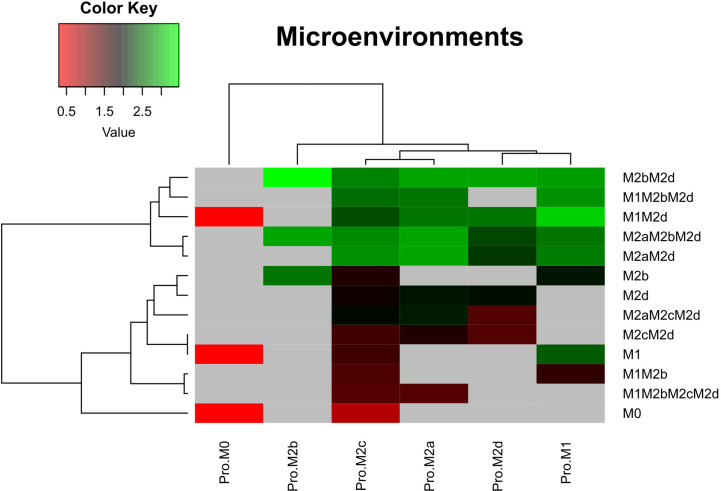
Figure 4.
Heat maps of the microenvironments of macrophage polarization. Microenvironments associated with the six phenotypes evaluated in this work. For these simulations we used the criteria of Table 2. Once the attractors were obtained, we applied a logarithmic transformation on the size of the basin of attraction for each phenotype. Red stands for a low basin of attraction and green for a high basin of attraction. Pro means we modelled the polarization in a microenvironment adjuvant for each macrophage subtype. M0, monocytes.

