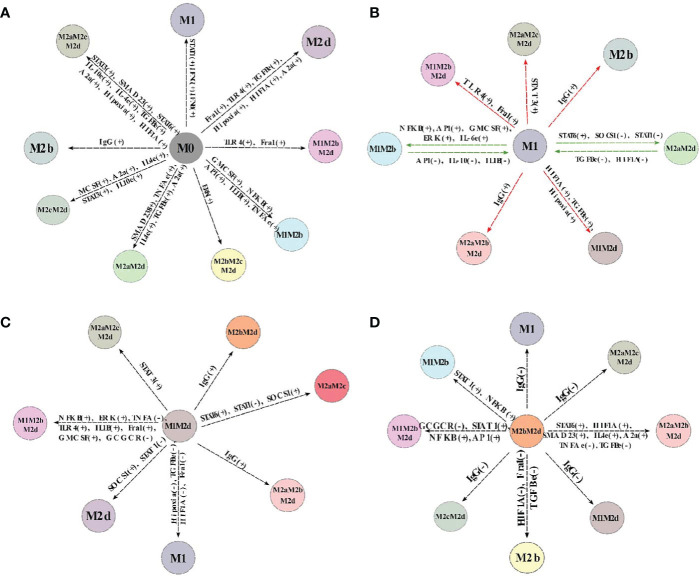
Figure 5.
Cell fate map of the macrophage polarization. Of all the attractors obtained, we changed the node’s value and maintained this perturbation until an attractor was reached. If the attractor’s transition to another phenotype, we represent it with a line and the new phenotype obtained by the perturbation. Plus sign (+) means the node was turned off, and we turn it on, while minus sign (-) means the perturbation was on, and we turned off. (A) Cell fate map of monocyte (M0). (B) Cell fate map of M1 macrophage. (C) Cell fate map of M1M2d macrophage. (D) Cell fate map of M2bM2d macrophage. Colors represent different states of macrophage polarization.

