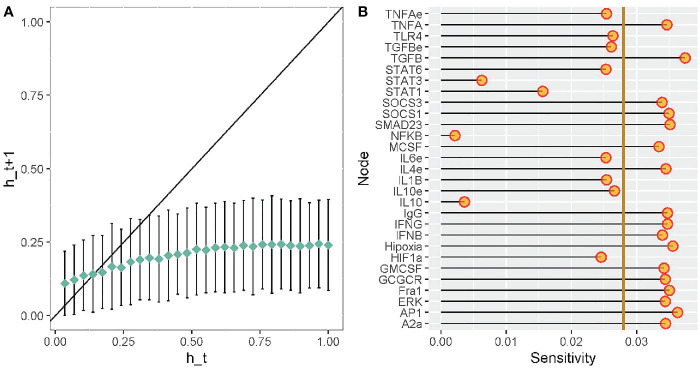
Figure 8.
Robustness analysis of our transcriptomic regulatory network of macrophage polarization. Sensitivity analysis of each node from our transcriptional regulatory network of macrophage polarization. (A) Derrida curves of our transcriptional regulatory network of macrophage polarization in a tumor microenvironment. (B) Sensitivity analysis of the variables in our transcriptional regulatory network of macrophage polarization in a tumor microenvironment. Golden line is the mean of the value of the sensitivity analysis.

