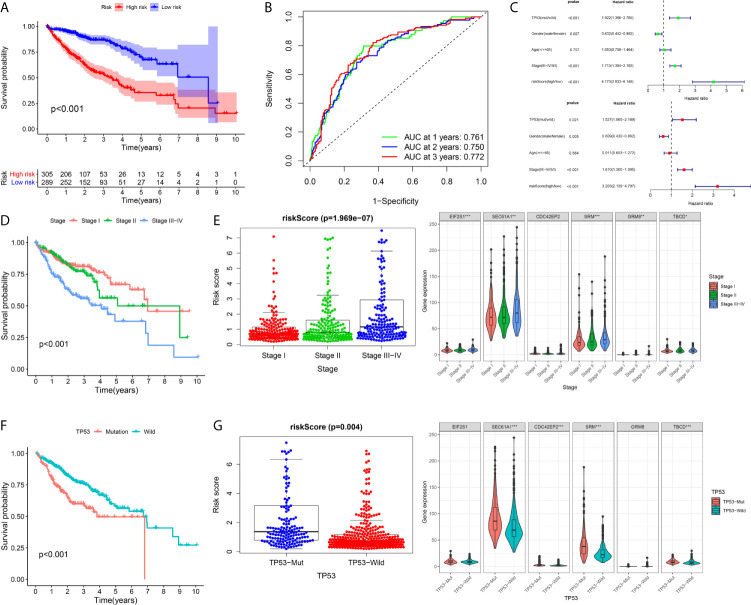
Figure 9.
Integrated analysis of the prognostic signature in whole cohort (A–C) The Kaplan–Meier survival analysis, time−dependent ROC analysis, and independence analysis of the signature for predicting the overall survival of patients in the whole cohort(n=594) (green represents univariate analysis, and red represents multivariate analysis) (D, E) The relationship between the risk score and TNM-stage (F, G) The relationship between the risk score and TP53. ***p < 0.001; **p < 0.01; *p < 0.05.

