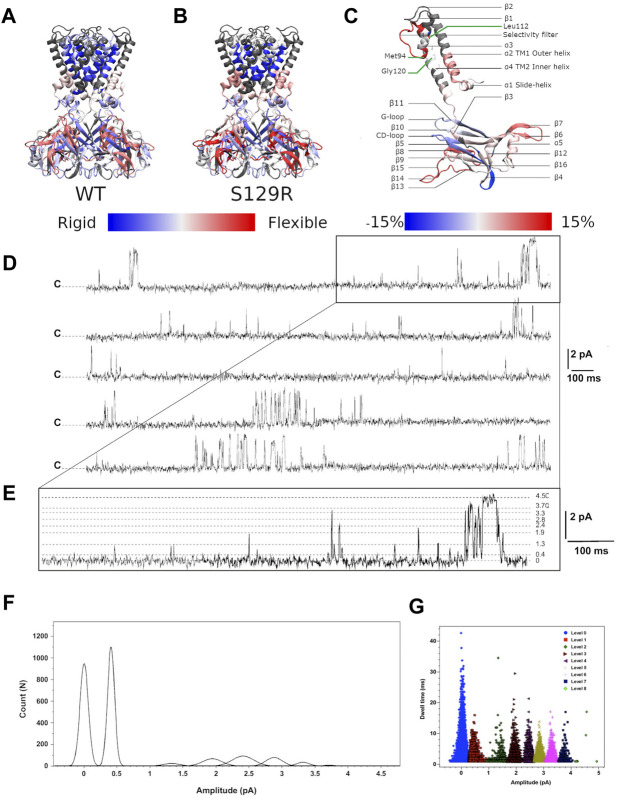
FIGURE 2.
HDX-MS and single channel recordings HDX-MS rates of peptides reported for (A) KirBac3.1 WT (Forest et al., 2016) and (B) the mutant S129R. Identified peptides are drawn with blue (low exchange and low flexibility) to red (high exchange and high flexibility) color according to their percentage of deuterium exchange after 1,200 s (scale of exchange shown at the bottom of the figures). (C) Nomenclature of secondary structures and rate of exchanges between the mutant S129R and KirBac3.1 WT. Scale of deuterium exchange rate is shown at the bottom of the figures, same color code as for A and B. Red appears when S129R is more flexible than WT and blue when S129R is more rigid than WT (D) Single channel recordings from KirBac3.1 S129R channels, traces obtained from 6 min consecutive recordings at +150 mV holding potential. Closed state is labeled c (E), an enhancement of the upper trace to show the multiple sub states induced by the S129R mutant (F) amplitude histogram fits (Gaussian) of all events for the selected levels gating between closed and open states during 6 min (G) S129R channels gate with multiple subconductance states. Dwell time for all events at 150 mV test potential is plotted for all current levels.

