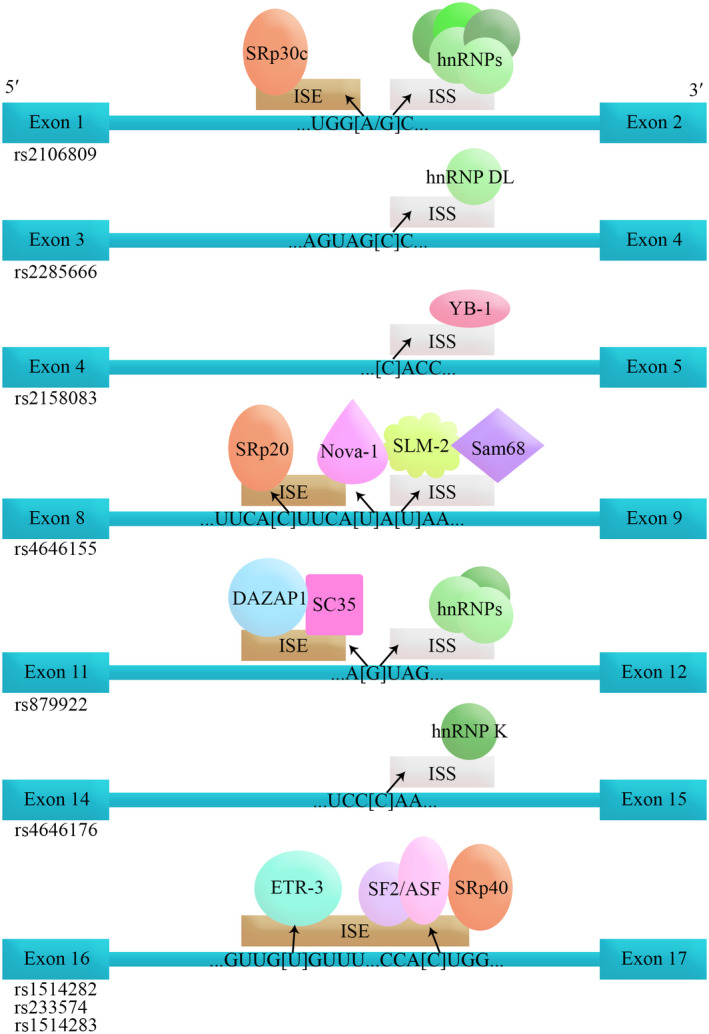
FIGURE 2.

The schematic sketch of splicing factors binding to their relative sequence. Only the binding alleles are shown. The arrows show the creation of differential splicing regions and the corresponding splicing factors by the specific allele. Square brackets are demonstrating the polymorphism. ISE, intron splicing enhancer; ISS, intron splicing silencer
