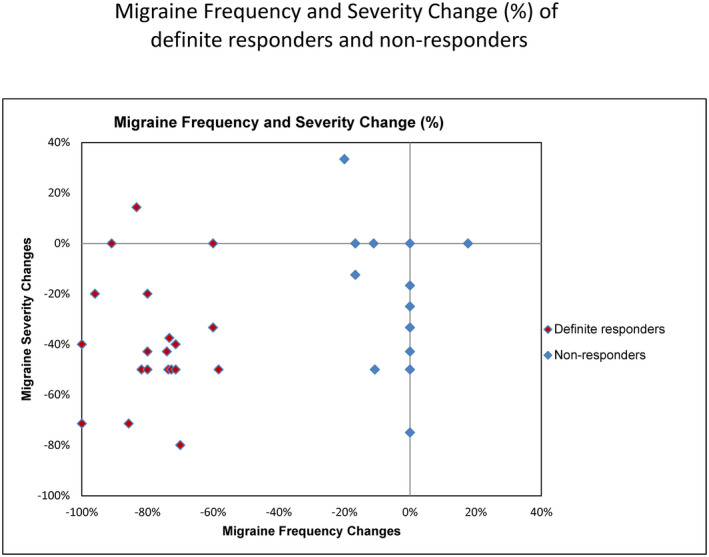
FIGURE 2.

Distribution of the extreme responders and non‐responders to verapamil treatment studied in the WES phase shows a clear separation of the two groups. Subjects are plotted using the % change in the number of headache days pre‐treatment to the number of headache days post‐treatment versus % change in headache severity (0–10 visual analog scale) pre‐treatment to post‐treatment
