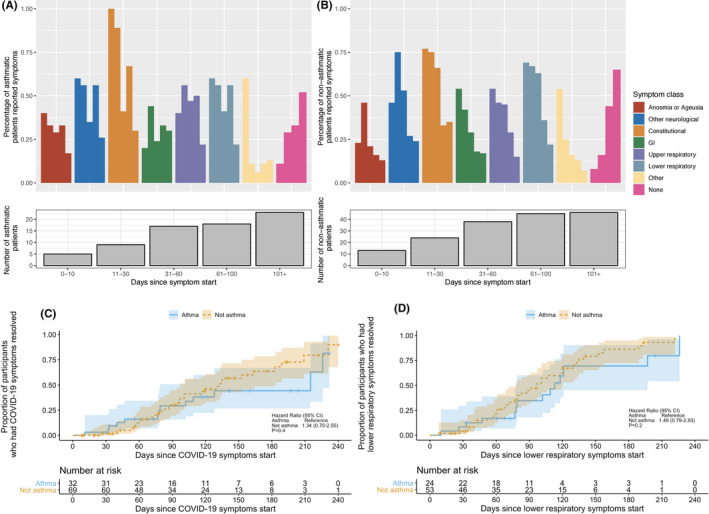
FIGURE 6.

Longitudinal symptoms in asthmatic COVID‐19 patients. Legend: Longitudinal symptoms were followed in a subgroup of asthmatic and non‐asthmatic COVID‐19 patients. Patients were seen in visit windows including 0–10 days, 11–30 days, 31–60 days, 61–100 days, and 101+ days from symptom onset. Bar graph showing frequency of asthmatic A, and non‐asthmatic B, patients reporting symptoms in each symptom class over time by visit window. “None” indicates frequency of patients who reported not having any symptoms; number of patients seen in each visit window is shown below the bar graph. C, Kaplan‐Meier curves of time to all symptom resolution and corresponding 95% confidence interval bands by asthmatic and non‐asthmatic COVID‐19 patients. p value was based on the log‐rank test. D, Kaplan‐Meier curves of time to lower respiratory symptom resolution and corresponding 95% confidence interval bands by asthmatic and non‐asthmatic COVID‐19 patients. p value was based on the log‐rank test
