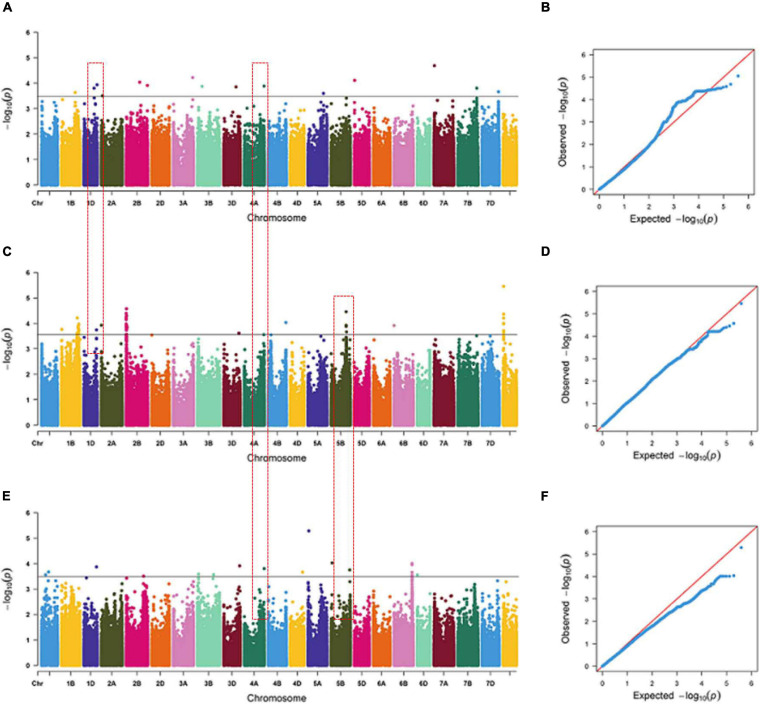
FIGURE 2.
Manhattan and Q-Q plots for total root length (TRL) under indoor hydroponic culture (A,B), outdoor hydroponic culture (C,D), and outdoor pot culture (E,F). The chromosomes on the x-axis and –log10 (p) values on the y-axis were all based on BLUE values. The gray line indicates the threshold of significance at –log10 (p) = 3.5. The red text box represents the co-localization region among different growing environments.

