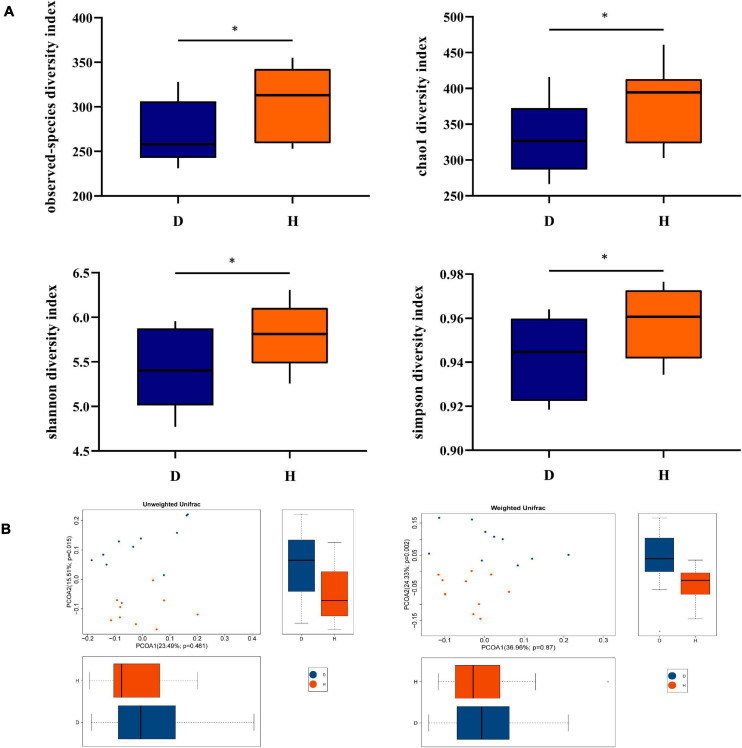
FIGURE 1.
Diversity analysis of fecal microbiota between groups D and H. (A) Alpha diversity is the index of species variety in a single sample, including the observed species, chao1, shannon, and simpson. (B) Principal Coordinates Analysis (PCoA) was used to further demonstrate the differences in species diversity between samples, it can reveal the magnitude of the differences between samples. PCoA analysis results of species diversity between samples, if two samples are close to each other, it means that the species composition of these two samples is similar (D, Diarrhea; H, Health). *difference between the two groups is significant(p < 0.05).

