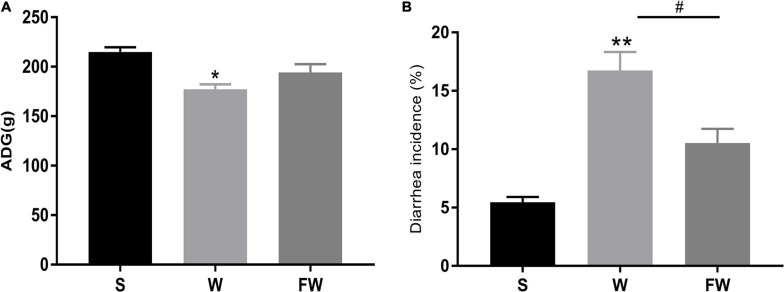
FIGURE 5.
ADG (A) and diarrhea incidence (B) of group S, W, and FW. The symbol “*” represented that the W and FWs group were compared with the S group, the symbol “#” represented that the FW group was compared with the W group. Data were shown as mean ± SEM (*p < 0.05, **p < 0.01, and #p < 0.05) (S, Sucking; W, Weaned; FW: FMT+Weaned). (1) ADG was calculated as weight gain (final body weight-initial body weight) divided by the number of treatment days. (2) The incidence of diarrhea (%) was calculated as the total number of diarrheal piglets during the period divided by the total number of piglets multiplies duration of the trial.

