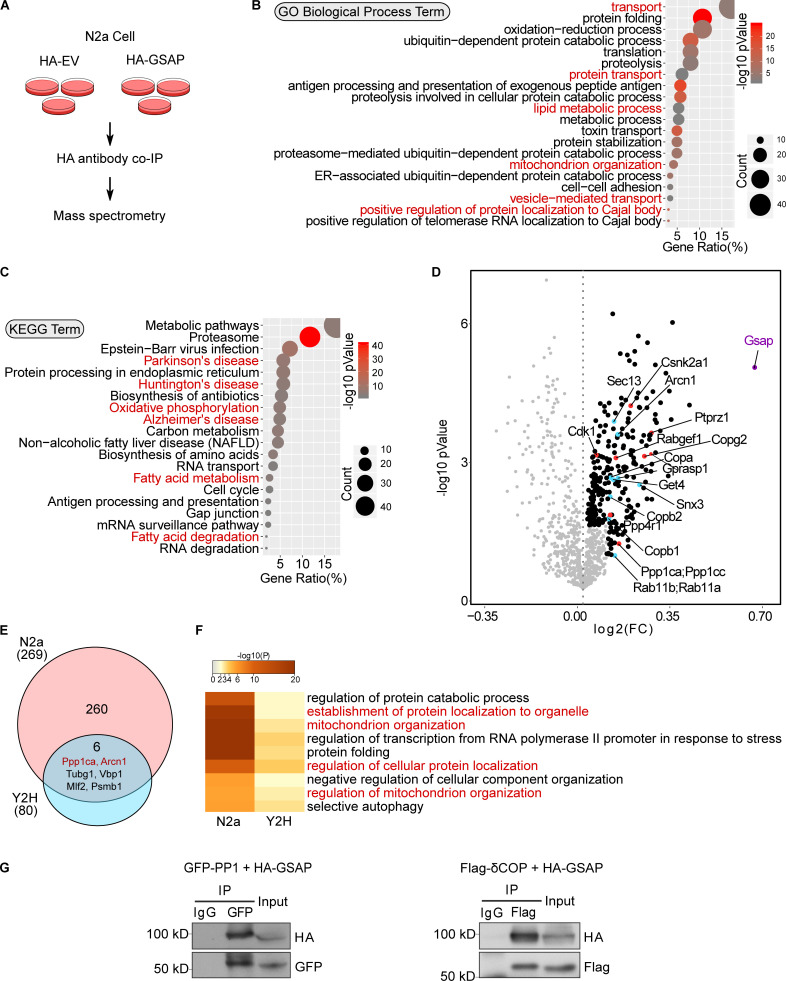
Figure 1.
GSAP and its binding proteins are involved in novel biological pathways. (A) Schematic of the experimental design to characterize the GSAP interactome. HA-EV was used as a negative control. (B) GO pathway enrichment analysis for GSAP-binding proteins. Top 20 significantly enriched pathways (P < 0.05) are shown based on P value (dot color) and gene count (dot size). (C) KEGG biological process enrichment analysis for GSAP-binding proteins. Top 20 significantly enriched pathways (P < 0.05) are shown based on P value (dot color) and gene count (dot size). (D) Volcano plot showing differentially enriched proteins (detailed in the methods) in HA-GSAP versus HA-EV co-IP MS experiments in N2a cells. GSAP itself (purple), proteins involved in trafficking (blue), and phosphorylation (red) are highlighted. FC, fold change. (E) Venn diagram showing overlapped protein between different lists. The circle area is not proportional to the sample size. (F) Meta-enrichment analysis of common GO biological pathways shared by two GSAP-binding protein lists. (G) Co-IP validation of GSAP interaction with PP1 and δ-COP (Arcn1) in HEK293T or N2a cells, respectively, via transient transfection. Representative data of three experiments.

