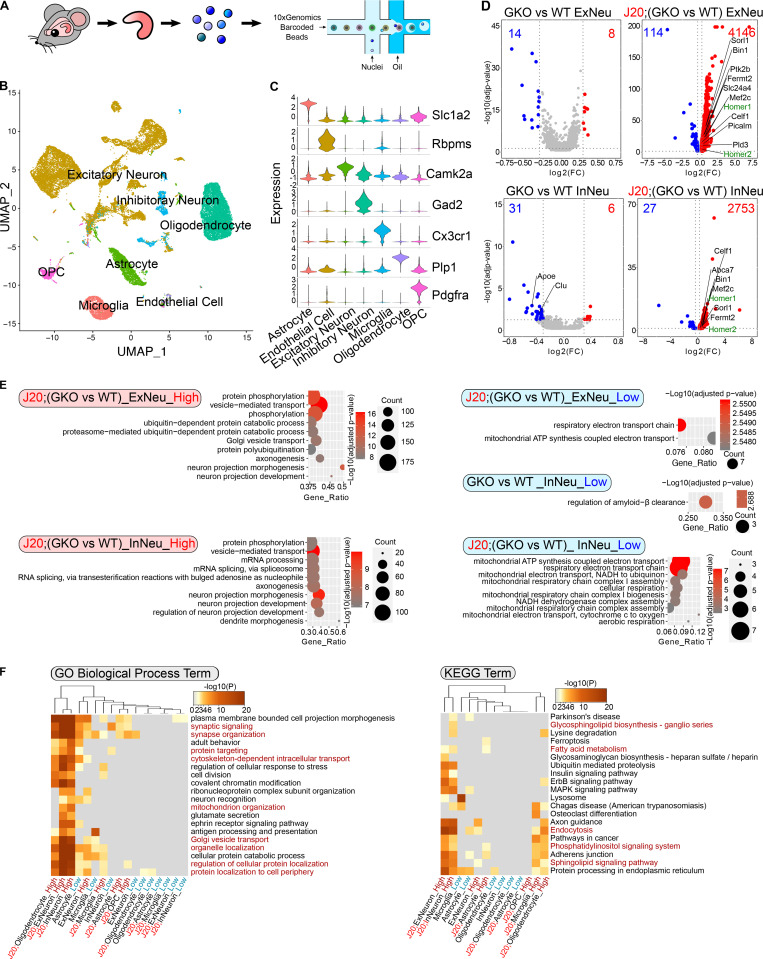
Figure 3.
sn-RNAseq analysis of GSAP KO mouse hippocampus. (A) Schematic diagram of the experimental design for sn-RNAseq of mouse hippocampus (WT, GKO, J20;WT, and J20;GKO) using the 10X Genomics platform. Sequencing data from different genotypes were merged for downstream analysis. (B) UMAP plot showing seven major cell types clustered based on gene expression profile in an unsupervised manner. (C) Violin plot showing expression level of representative marker genes from different cell clusters: Slc1a2 (astrocyte; 3,220 nuclei), Rbpms (endothelial cell; 213 nuclei), Camk2a (excitatory neuron; 15,845 nuclei), Gad2 (inhibitory neuron; 1,961 nuclei), Cx3cr1 (microglia; 2,210 nuclei), Plp1 (oligodendrocyte; 7,187 nuclei), and Pdgfra (oligodendrocyte progenitor cell [OPC]; 1,287 nuclei). (D) Volcano plots showing DEGs in neuronal clusters comparing WT versus GKO or J20;WT versus J20:GKO. Only genes with significantly expression level change are shown (adjusted P value < 0.05; log2[fold change (FC)] < −0.3 or > 0.3). Genes with higher expression level in GKOs are highlighted in red, and genes with lower expression level in GKOs are highlighted in blue. AD risk genes are in labeled in black, whereas synaptic genes are labeled in green. (E) GO biological process enrichment analysis for DEGs in neuronal clusters. Top significantly changed pathways (up to 10) are shown (adjusted P value < 0.05). (F) Meta-enrichment analysis of common GO (left panel) and KEGG (right panel) pathways shared by both up-regulated and down-regulated DEGs from all the cell types.

