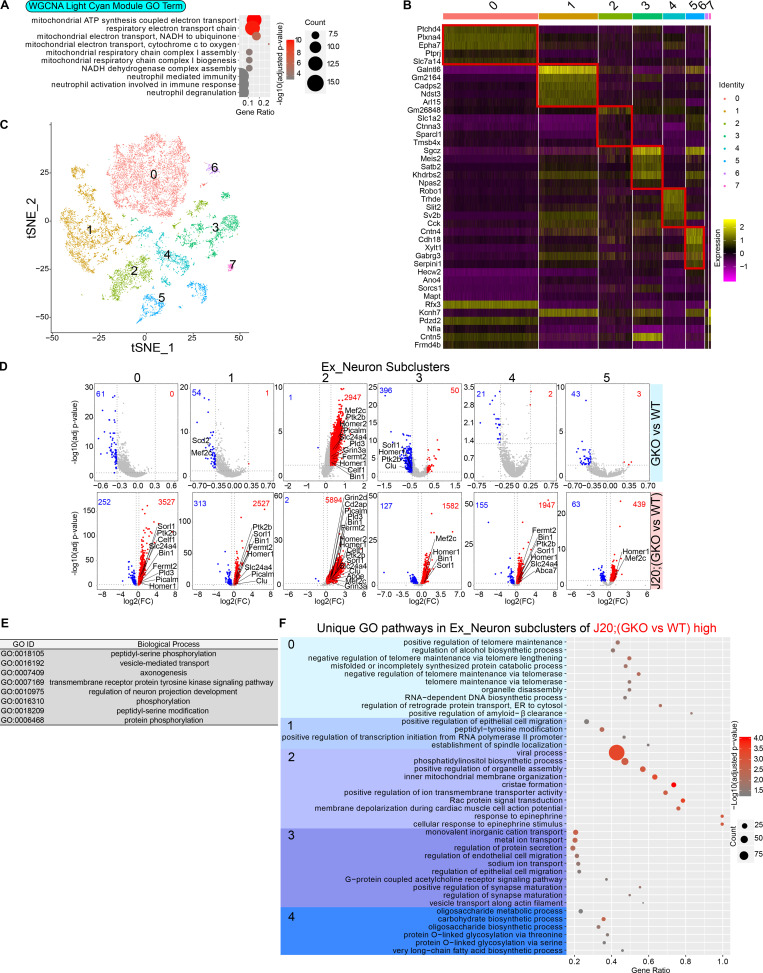
Figure 4.
Characterization of GSAP function in excitatory neurons. (A) GO biological process enrichment analysis for genes enriched in the WGCNA light cyan module of excitatory neurons. Top significantly changed pathways (up to 10) are shown (adjusted P value <0.05). (B) Heatmap showing the expression level of the top five differentially enriched genes in each excitatory neuron subcluster. (C) t-Distributed stochastic neighbor embedding (t-SNE) plot depicting the excitatory neuron cluster, which is divided into eight subclusters in an unsupervised manner. (D) Volcano plots showing DEGs in excitatory neuron subclusters comparing GKO versus WT or J20;GKO versus J20:WT. Genes with significant changes in expression levels are shown (adjusted P value <0.05; log2[fold change(FC)] < −0.3 or > 0.3). Up-regulated genes in GKO are highlighted in red, and genes down-regulated in GKO are highlighted in blue. (E and F) GO biological process pathways analyses were performed with up-regulated genes comparing J20;GKO versus J20;WT mice. GO biological pathways shared by all five neuron subclusters are shown in E, and GO biological pathways uniquely overrepresented in specific clusters are shown in F.

