Figure 5.
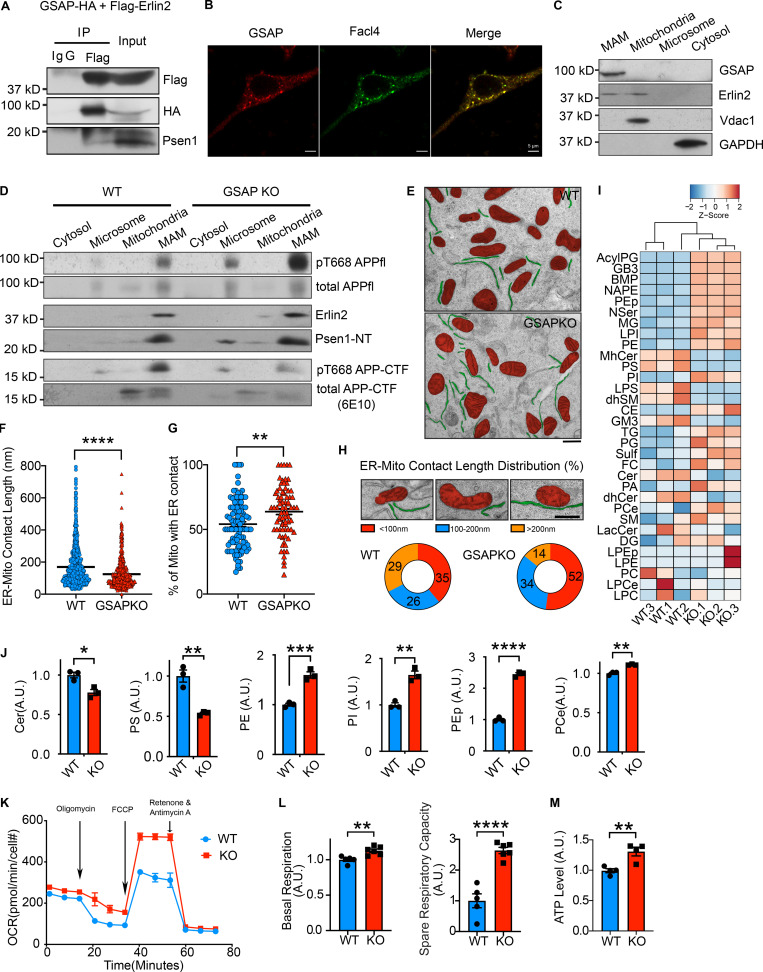
GSAP regulates lipid metabolism and mitochondrial function through the MAM. (A) Co-IP analysis of GSAP (HA-tagged) interaction with Erlin2 (Flag-tagged) and Psen1 using an HA antibody in N2a cells. Representative data of two experiments. (B) Immunofluorescence of overexpressed GSAP and MAM marker protein Facl4 in CAD cells. Scale bars, 5 µm. Representative data of five cells. (C) Equal amount of protein from different fractions of N2a695 cells were loaded into each lane for SDS-PAGE and immunoblot analysis with indicated antibodies. Representative data of two experiments. (D) Equal amounts of protein from different fractions of WT and GKO HEK293-APP cells were loaded into each lane for SDS-PAGE and immunoblot analysis. Representative data of two experiments. (E) Representative EM images of WT and GKO SHSY-5Y cells. Mitochondria (red) and ER (green) are highlighted. Scale bar, 500 nm. (F) ER–mito contact lengths are quantified on the ER side in WT (n = 106) and GKO cells (n = 76). Data represent mean ± SEM; unpaired t test, ****, P < 0.0001. (G) The proportion of mitochondria with ER contact is quantified in WT (n = 106) and GKO cells (n = 76). Images were analyzed in a blinded manner. Data represent mean ± SEM; unpaired t test, **, P < 0.01. (H) Representative EM images of three categories of ER–mito contact based on contact length (upper panel). Scale bar, 500 nm. Proportion of ER–mito contact length in each category is quantified in WT (n = 106) and GKO cells (n = 76). (I) Heatmap showing levels of different lipid subclasses in WT and GKO SHSY-5Y cells by lipidomic analysis. Full lipid names have been defined in Fig. S4 A. (J) Cer, PS, PE, PI, PEp, and ether PCe levels were quantified based on lipidomics analysis. Data represent mean ± SEM, unpaired t test; *, P < 0.05, **, P < 0.01; ***, P < 0.001; ****, P < 0.0001. (K) OCRs of WT and GKO cells were measured in real time by Seahorse assay. Data were normalized to cell count and represent mean ± SEM. Representative data of two experiments. (L) Basal OCR and SRC were compared between WT and GKO cells. Data represent mean ± SEM; unpaired t test, **, P < 0.01; ****, P < 0.0001. (M) Total intracellular ATP was compared between WT and GKO cells cultured in media without glucose. Data represent mean ± SEM; unpaired t test, **, P < 0.01.

